.svg)

Is your GPU working hard right now?
Have you ever been to Yongsan Electronics Mall to buy 32 MB or 64 MB memory?
As Intel founder Gordon Moore said, hardware performance has evolved exponentially over decades. As a result, the price/performance ratio of CPU, memory, and disk has become very high, and recently, due to the overall decline in hardware prices, we often encounter cases where the computing power of enterprises exceeds actual needs.
Since the advent of ChatGPT, we've realized that technology is advancing faster than ever before. AI-related news accounts for the majority of the latest technology news and conferences, and many companies are working to develop AI services and apply them to their services.
GPUs have become an essential resource in the AI era, but due to their significantly higher price compared to other devices, the need for policies and solutions for more efficient use is emerging.
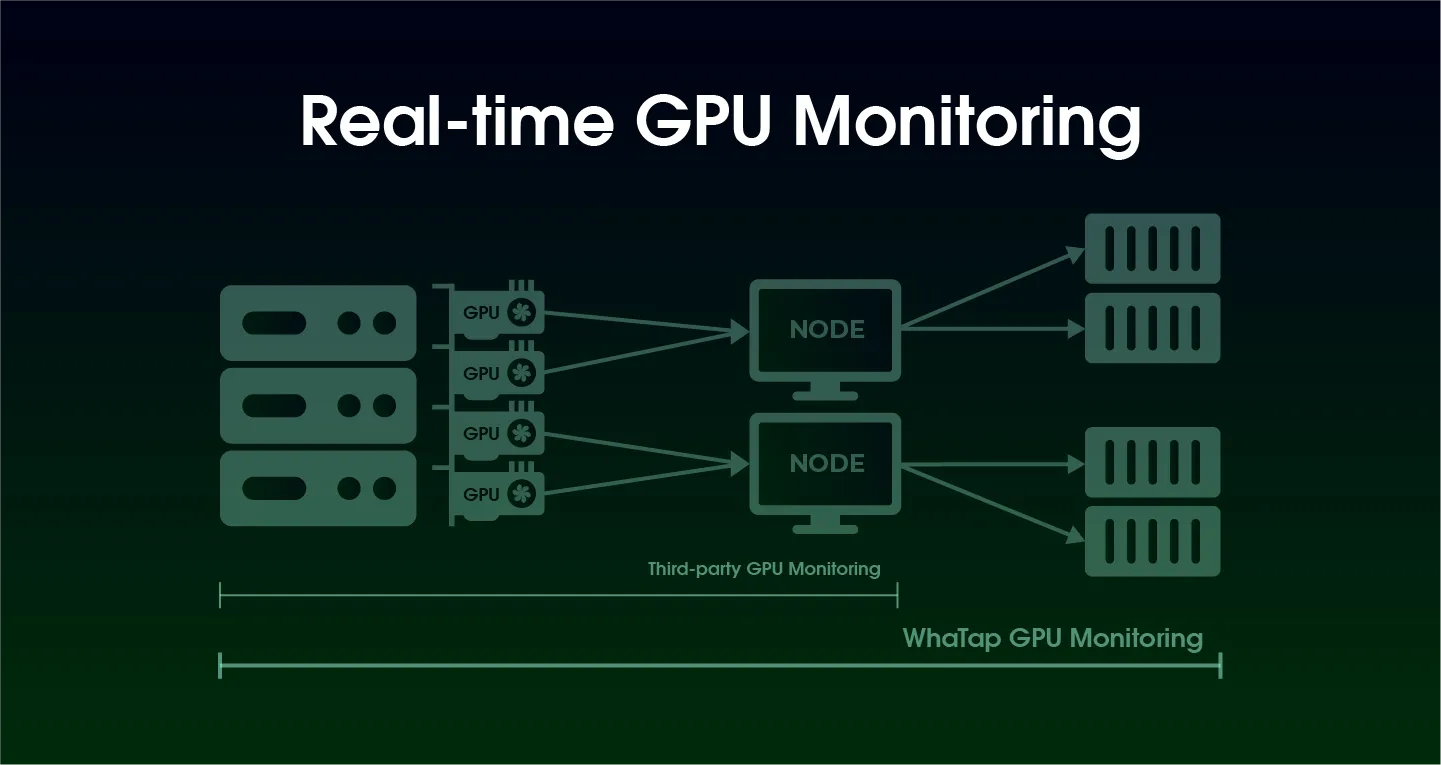
Watap, which provides specialized monitoring solutions, has launched GPU monitoring features for infrastructure and Kubernetes to reflect customer needs. You can check in real time whether the customer's expensive GPU is being used properly and whether problems are occurring.
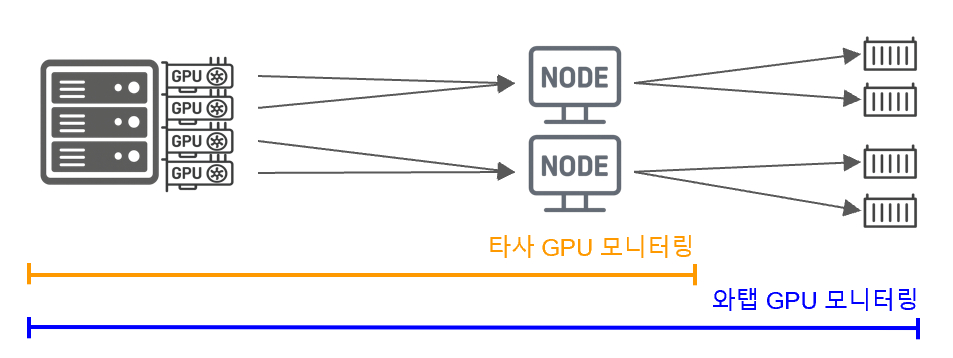
Of course, platforms that provide Kubernetes or some solutions that allocate GPU resources also provide the ability to check basic GPU status.
However, what are the differences between WTAP's GPU monitoring, which is a specialized monitoring solution?
First, understand the characteristics of the target to be monitored and quickly accommodate customer needs
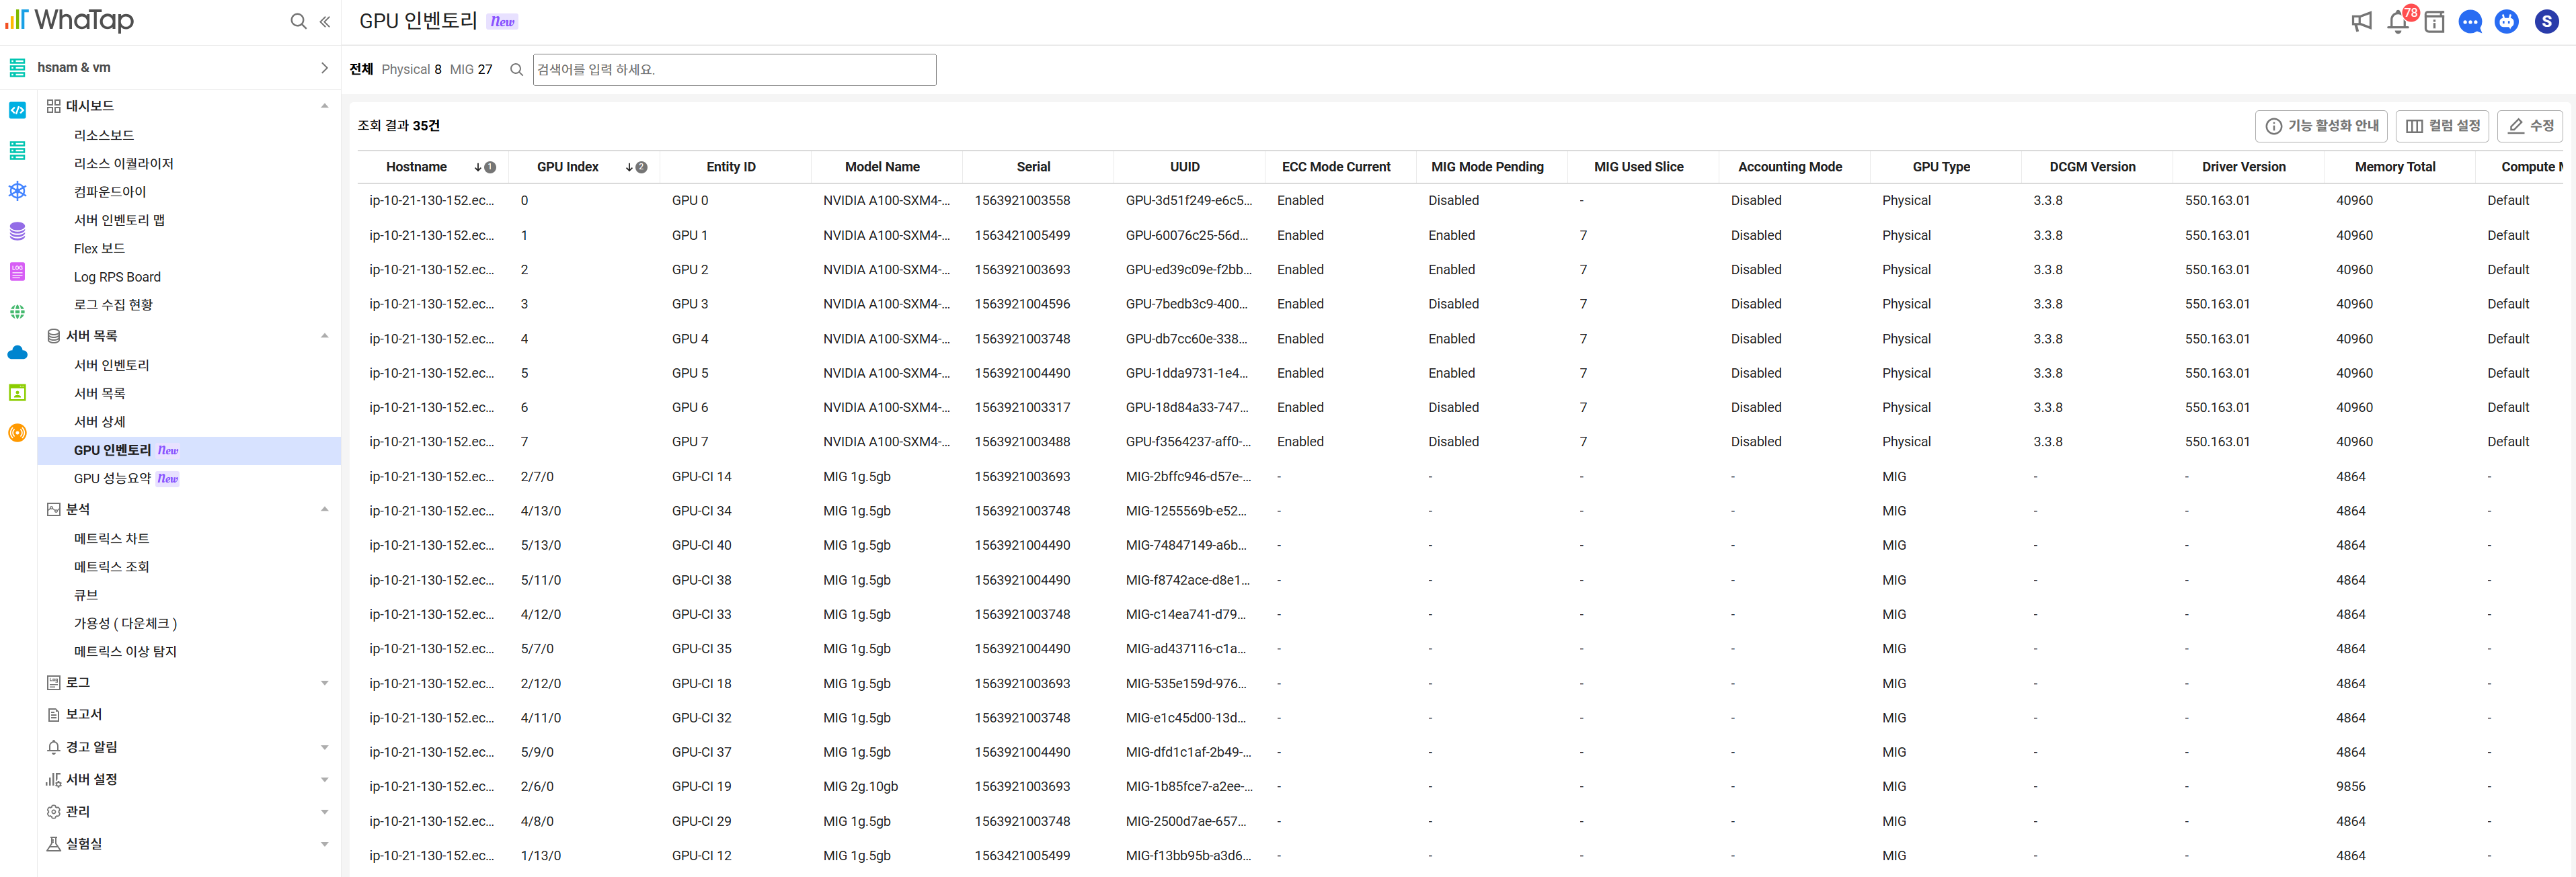
If large-scale GPU farms are configured and assigned to organizations and individuals, a separate resource management system is required. Server monitoring provides GPU inventory functionality.
- Status and status of all GPUs (MIGs)
- Usage status by department/project
- GPU filtering for fault response or maintenance
etc. can be checked at a glance. Also, in conjunction with Kubernetes monitoring, inventory information can be used together.
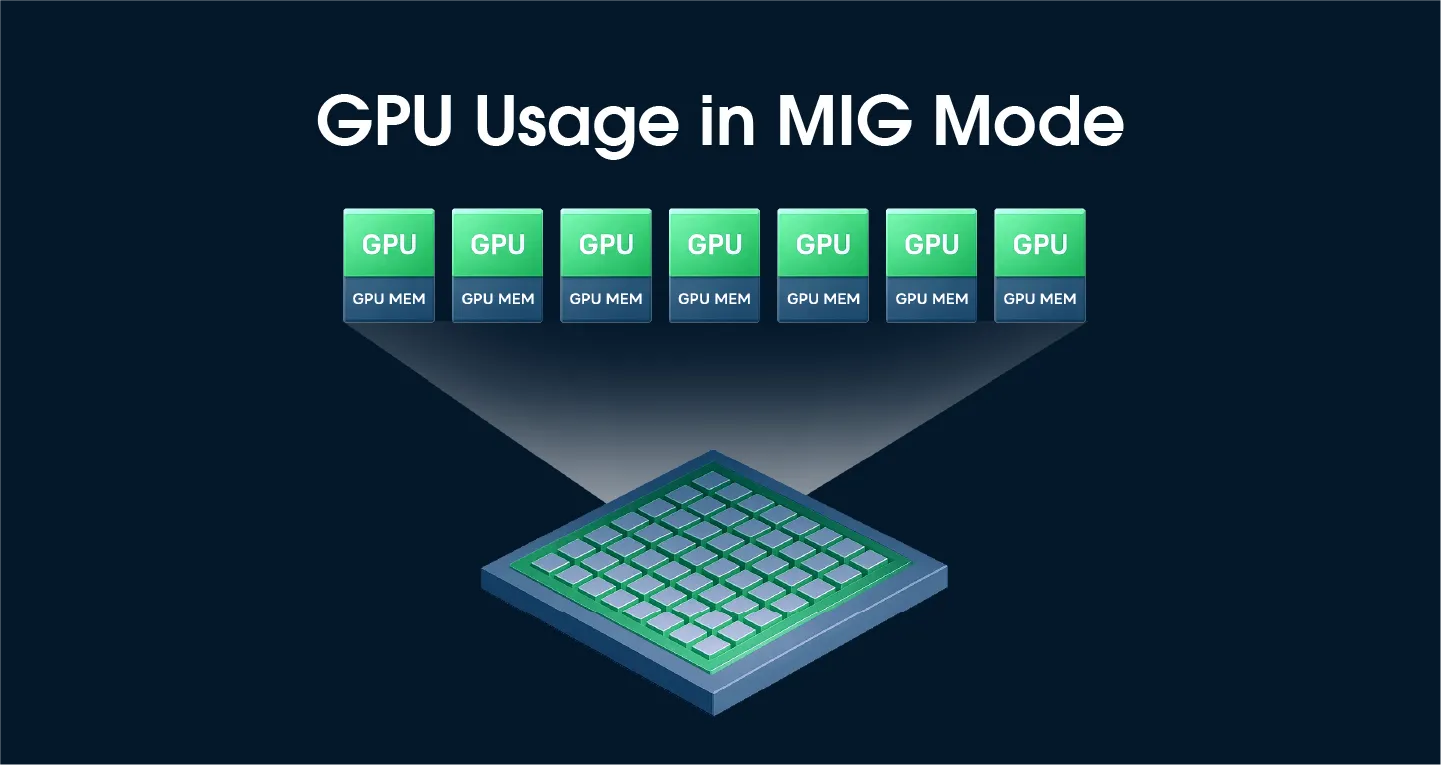
💡 Multi-Instance GPU (MIG): A technology that allows multiple workloads to run simultaneously by splitting a GPU into multiple independent virtual GPU instances
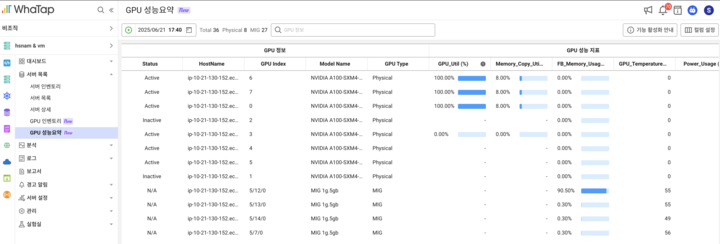
Second, you can quickly check and manage the status of individual devices in large GPU farms.
It is necessary to reduce costs and secure availability through resource relocation by identifying differences in GPU utilization rates or bottlenecks and load segments of specific workloads. Server monitoring supports MIG environments and allows you to quickly check GPU status and utilization through real-time key metrics.
Third, it provides a visual screen that can identify multiple resources at a glance.
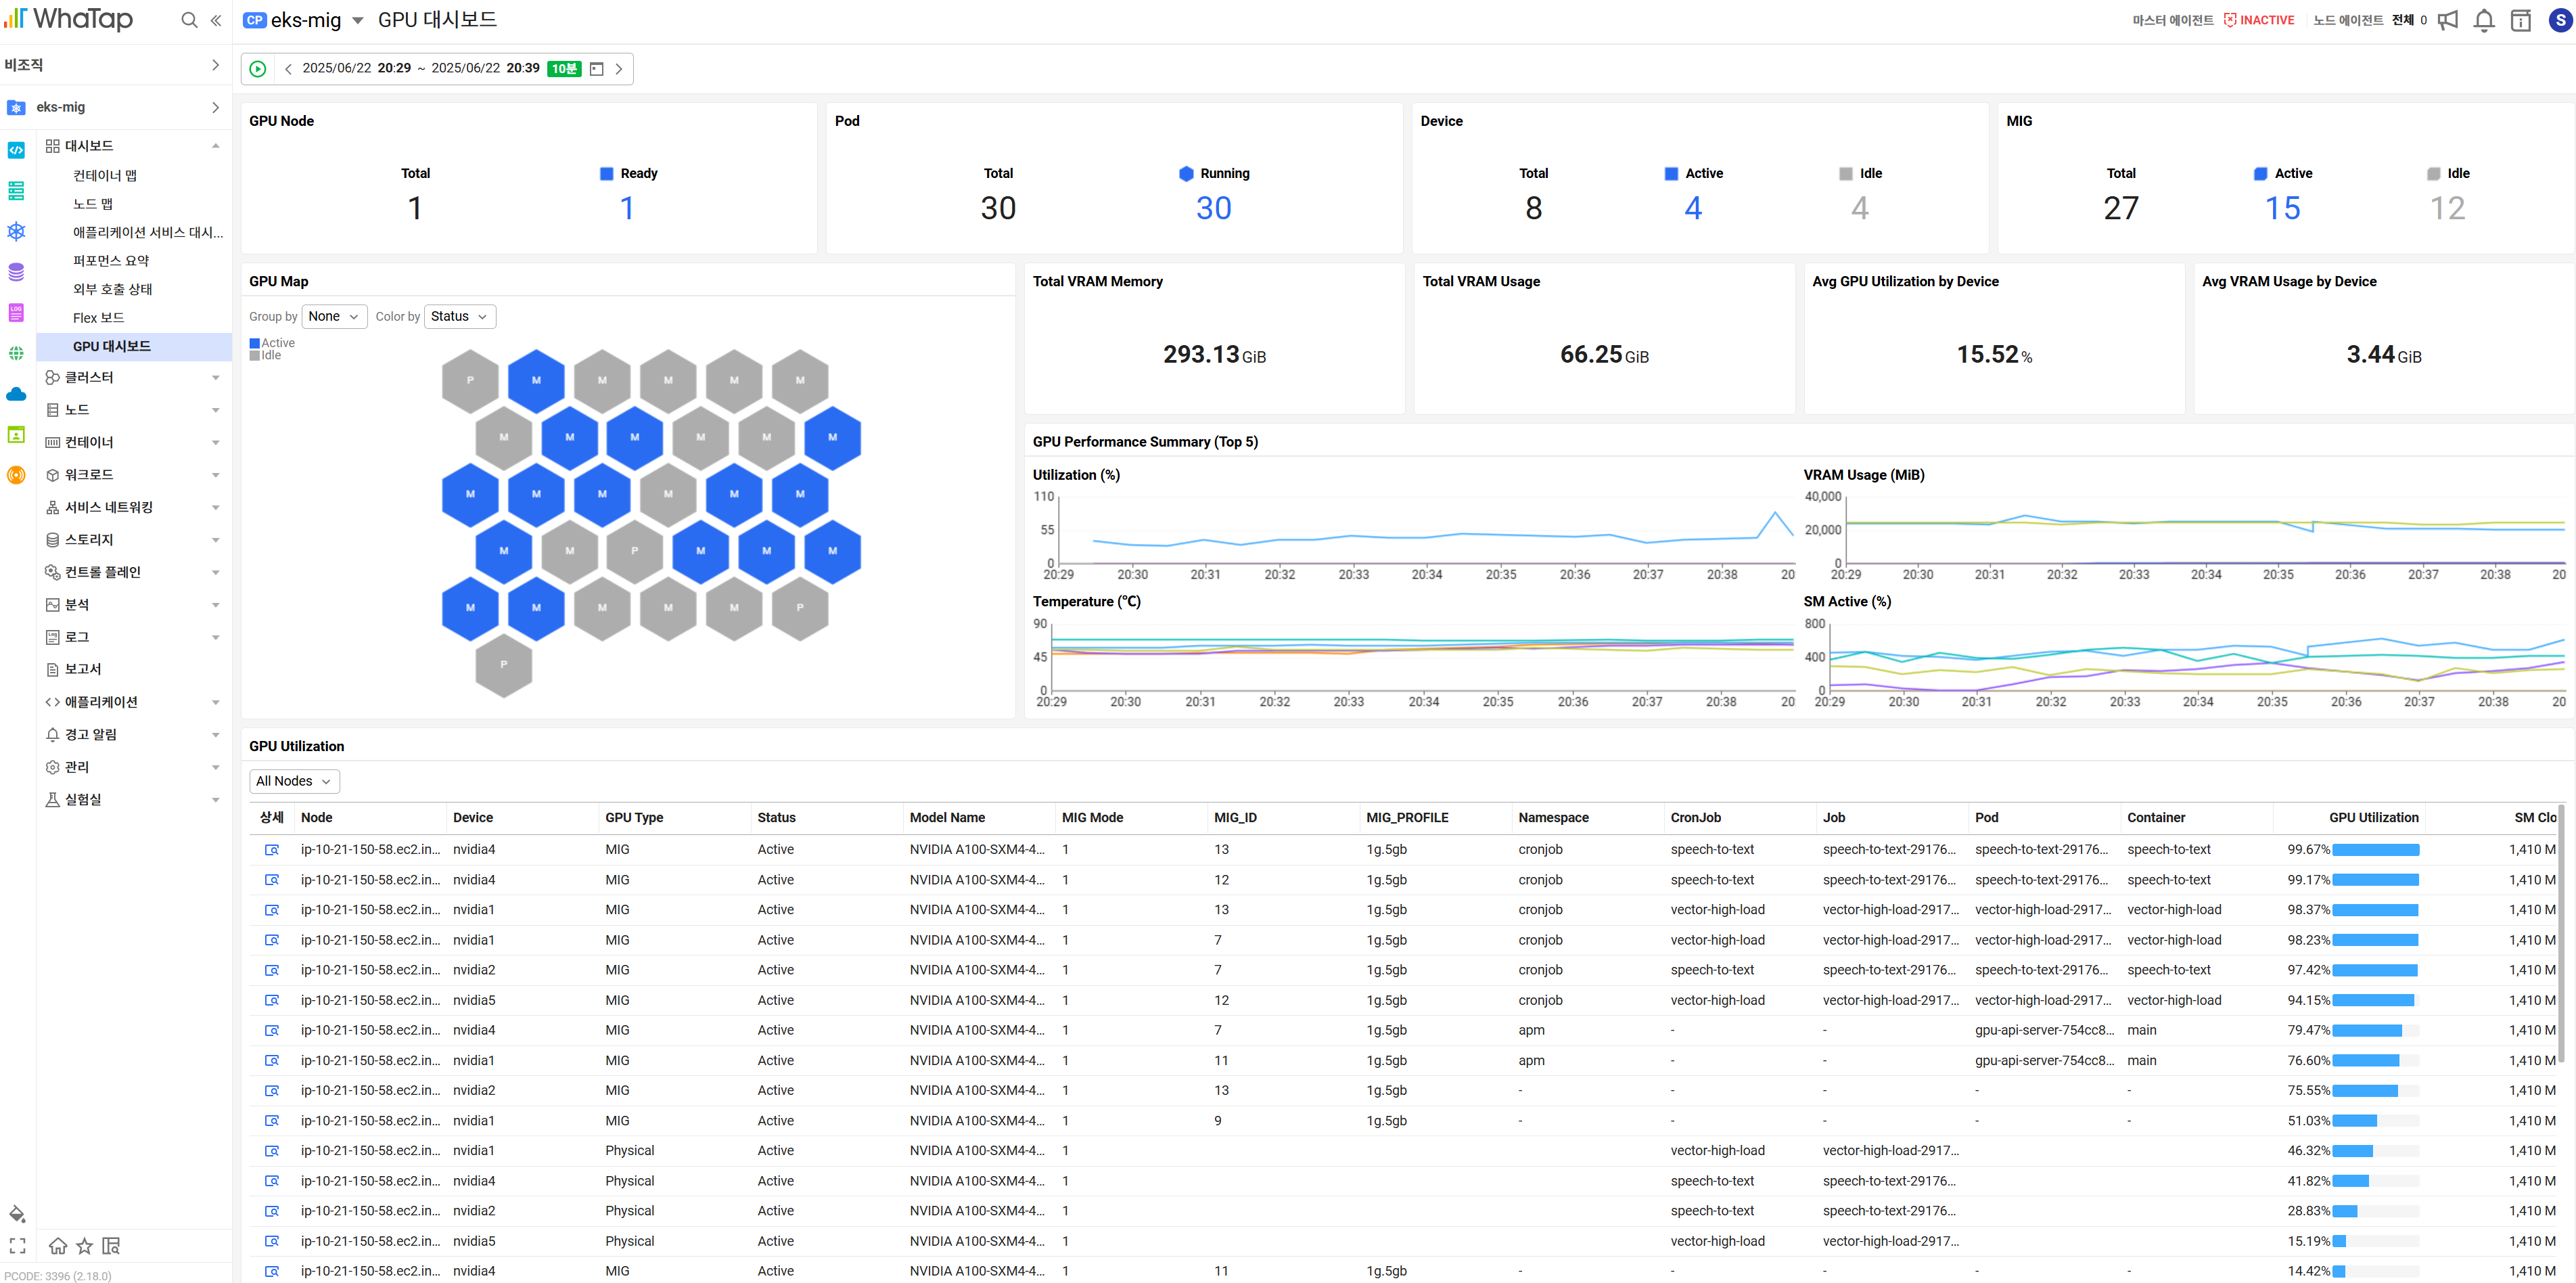
The GPU dashboard provides comprehensive visual information about the nodes, pods, and GPUs (MIG) to which GPUs are assigned. You can check the status and usage rate of the GPU on the GPU map screen, and even connect to the actual application that uses the resource to identify it.
Fourth, it provides analytical information linked from infrastructure to applications.
It helps you quickly track the cause according to the user's analysis flow without having to check numerous indicators one by one. It is possible to analyze all areas from hardware to applications rather than fragmentary figures. For example, if you use the container map function, you can visualize containers based on GPU usage, and if the APM function is configured together, you can comprehensively check even the application level.
![[쿠버네티스 모니터링] 컨테이너맵](https://cdn.prod.website-files.com/683542e0144e8b6bf7a76d7b/68a5798f4c3e9132070f6c7b_6874b21ad8f6d82664cb5791_6873aa632941e0ce6223f96d_image%2525204.png)
Fifth, you can quickly identify correlations by selecting only the metrics you need.
The data collected by NVIDIA GPUs is very diverse.
Key metrics such as GPU utilization and memory utilization are built-in to the dashboard, but the metrics that are important to each organization or operational purpose may vary. With the existing Matrix Explorer function, you can select and visualize only the desired indicators and quickly analyze correlations.
![[서버 모니터링] 매트릭스 익스플로러](https://cdn.prod.website-files.com/683542e0144e8b6bf7a76d7b/68a5798f4c3e9132070f6c74_6874b21ad8f6d82664cb578b_6873aab05da735d72bc5392d_image%2525205.png)
finishing
Just as a single server is divided into VMs with cloud and hypervisor solutions, GPUs are increasingly being logically divided and used using MIG functions. To effectively utilize resources, we first need data and visibility that can accurately grasp the current situation. WTAP will continue to improve monitoring and analysis functions so that customers' GPUs can be used properly.
We hope you can operate GPU resources more efficiently and with clear visibility through Watap GPU monitoring.