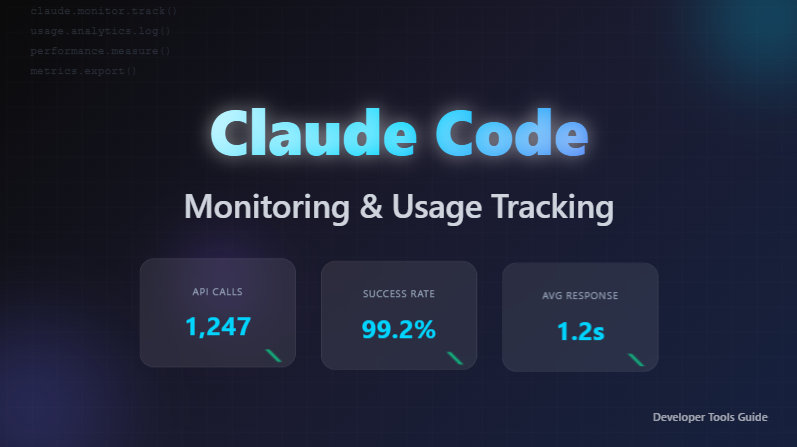
Claude Code and the need to monitor AI development tools
Claude Codeis an AI-based developer tool developed by Anthropic, AI code generation, Automated refactoring, Code reviews, Create tests It supports various development workflows, etc. However, the more powerful the tool, the more important it is to accurately understand its usage and effects. This is especially true when used at the team or organization level.
Why monitoring AI development tools is essential
AI API cost management and token usage tracking
- Token usage monitoring: Track token consumption by model such as Claude Sonnet and Opus in real time
- Cost forecasting and optimization: Predict and manage AI API usage costs for each project and developer in advance
- Set usage limits: Automatic reminders and restrictions to prevent budget overruns
Measuring development productivity KPIs and AI tool ROI
- Code generation metrics: Number of code lines generated by AI, number of modified files, number of refactorings applied
- Faster development: Improved pull request creation time, code review completion time, and bug fix speed
- Utilization by tool: Analysis of usage frequency for each Claude Code feature such as Write, Edit, and Read
- Developer satisfaction: Comparing development experience before and after introducing AI tools and quantifying productivity improvements
Observability of agnotic workflows
When using Claude Code as an agent, it's essential to track complex workflows and find bottlenecks. Workflows can be optimized by analyzing agents' decision-making processes and tool usage patterns.
Team collaboration and governance
At the organizational level, there is a need to understand how developers are using AI tools and share best practices. Audit tracking of the use of AI tools is also important from a security and compliance perspective.
Monitoring methods: from simple to advanced solutions
1. Simplest start: ccusage
.png)
If individual developers want to quickly understand their Claude Code usage, CCUSAGEis the best choice.
# 즉시 사용 (설치 불필요)
npx ccusage@latest

# 일별 사용량 확인
ccusage daily

# 실시간 모니터링
ccusage blocks --live

# 모델별 비용 분석
ccusage daily --breakdown
The main advantages of ccusage:
- 🚀 Can be run immediately without installation
- 📊 Usage reports in the form of a clean table
- 💰 Cost analysis by model (Opus, Sonnet, etc.)
- ⏰ Real-time usage dashboard
- 🎨 Colorful terminal output
It's the perfect solution for individual developers or small teams who want to quickly check usage. For more details, please refer to the GitHub project. [link]
2. More detailed monitoring: OpenTelemetry + professional tools
Beyond individual use, more systematic monitoring is needed when using Claude Code at a team or organization level. OpenTelemetryis an industry-standard observability framework that meets these requirements.
The value provided by OpenTelemetry
- Standardized metrics: number of sessions, amount of code changes, PR/commit generation, API costs, token usage, etc.
- Multi-platform support: Works with various backends such as Prometheus, Grafana, and Jaeger
- scalability: Stable operation even in large organizations
- security: Sensitive information is excluded from collection by default
Setting up Claude Code OpenTelemetry
To set up Claude Code's OpenTelemetry function, you can use environment variables or use configuration files.
- Setting environment variables
export CLAUDE_CODE_ENABLE_TELEMETRY=1
export OTEL_METRICS_EXPORTER=otlp
export OTEL_EXPORTER_OTLP_ENDPOINT=http://localhost:4317
export OTEL_EXPORTER_OTLP_PROTOCOL=grpc
- Managing configuration files
Claude Code supports configuration files in multiple locations:- Personal settings: ~/.claude/settings.json
- Project settings: ./.claude/settings.json
Add the following content to ~/.claude/settings.json: OTEL_METRICS_EXPORTER et OTEL_LOGS_EXPORTER console If you set it to, you can easily confirm that the exporter is set to the console log without a separate installation.
{
	"env": {
		"CLAUDE_CODE_ENABLE_TELEMETRY": "1",
		"OTEL_METRICS_EXPORTER": "otlp",
		"OTEL_LOGS_EXPORTER": "otlp",
		"OTEL_EXPORTER_OTLP_PROTOCOL": "grpc",
		"OTEL_EXPORTER_OTLP_ENDPOINT": "<http://localhost:4317>"
	}
}important information: The priority between configuration files must be understood correctly. If multiple settings conflict, data may not be queried as intended.
For more details and enterprise settings Anthropic's articlePlease refer to
3. Graphana-based open source monitoring: claude-code-otel
.png)
If building your own OpenTelemetry infrastructure is burdensome, claude-code-otel Try using the project. For details, please refer to the GitHub project. [link]
# 저장소 클론
git clone https://github.com/ColeMurray/claude-code-otel.git
cd claude-code-otel

# Docker 기반 모니터링 스택 실행
make up

# 대시보드 접근
# Grafana: <http://localhost:3000> (admin/admin)
# Prometheus: <http://localhost:9090>
Features provided by claude-code-otel:
- 📊 Pre-configured Grafana dashboards: cost analysis, user activity, tool performance
- 🔍 Prometheus metrics collection: Long-term data storage and analysis
- ⚡ Real time monitoring: Track current sessions and activities
- 🎯 Usage statistics by tool: Identify which Claude Code tools are used the most
Agent-based LLM monitoring that prepares you for the future
The present and future of AI agent monitoring
Current situationClaude Code is currently mainly metrics It provides central monitoring, Full tracking functionality for complex multi-agent workflows is not yet available. Currently possible monitoring is limited to basic usage metrics (token usage, frequency of API calls, amount of code generated, etc.) for individual Claude Code sessions.
Future prospects: AI is more complex Autonomous agents As you play a role, the three pillars of observability (Observability) — Metrics, Traces, and Logs — will all become important.
Future agmatic workflows and distributed tracking
Note: The advanced agent monitoring features described below are currently not directly supported by Claude Code, and they anticipate the future development direction of AI tools.
Get visibility into complex AI workflows
- Track how a development task is completed through multiple AI models and tools
- Analyze performance bottlenecks and causes of failure at each stage
- Understanding AI agent interactions through dependency maps
[사용자 요청] → [코드 분석 에이전트] → [테스트 생성 에이전트] → [리팩토링 에이전트] → [문서화 에이전트]
    ↓              ↓                    ↓                    ↓             ↓
  Span 1        Span 2               Span 3               Span 4        Span 5
Expected usage scenarios in practice:
- debugging: “Why did this PR take 3 times longer to create than usual?” → Check for bottlenecks in specific agents through traces
- optimizing: Identify and improve the most inefficient agent chain
- quality control: Analysis of success rates and retry patterns by agent
Structured logging and context tracking
Transparency in the AI decision-making process
{
  "timestamp": "2024-08-07T10:30:15Z",
  "trace_id": "abc123",
  "span_id": "def456",
  "agent": "code-reviewer",
  "action": "analyze_security",
  "context": {
    "file_path": "src/auth.py",
    "lines_analyzed": 45,
    "security_rules_checked": ["sql_injection", "xss", "secrets"]
  },
  "result": {
    "issues_found": 2,
    "confidence": 0.89,
    "recommendations": ["Use parameterized queries", "Sanitize user input"]
  }
}
Organization-level AI governance
Management systems required when scaling up
1. Allocate and limit usage
- Manage AI resource quotas by team and project
- Real-time usage monitoring and threshold notifications
- Automatic scaling and cost control
2. Quality and compliance
- Track quality metrics in AI-generated code
- Automated security scans and license compliance checks
- Generate audit logs and compliance reports
3. Collaboration and knowledge sharing
- Discover and share successful AI usage patterns
- Disseminating best practices for using AI tools across teams
- Improving the data base for developer training and onboarding programs
Bottom line: monitoring is a competitive advantage
Monitoring AI development tools like Claude Code is no longer an option but a necessity. Beyond simple usage tracking, it's a key element in securing transparency and efficiency in a new development paradigm where AI and humans collaborate.
Start simple, scale systematically!
- Individual developers: Start with ccusage to identify your AI usage patterns
- small team: Get team-level insights with claude-code-otel
- Company/Organization: Integrated management with enterprise solutions such as WhATap OpenMX
In the future, measuring and improving “how effectively they are collaborating with AI” will become a core competency for development teams, going beyond simply “how much AI has been used.” If we establish a monitoring foundation from now on, we will be able to advance even in more advanced AI development environments.
.svg)


