.svg)

What you can miss when you first adopt Kubernetes Resource requestsWith Limit settingsThis is it. If this is not set or set likely, it can reduce the entire cluster as well as reduce the availability of the application.
In this article, I will discuss the process of diagnosing problems and problems resource settings using monitoring tools, diagnosing on examples that resolve in actual operating environments.
1. Pods that Killed Nodes: Request/Limit optimization through regular report checks
This is an example of running a backend application in multiple languages after developing to Kubernetes without setting resource limits. This application uses few resources, but during certain periods of time, usage was measured, and CPU and memory usage was also skyrocketed.
Some pods were deployed to the cluster without setting resource requests (requests) and limits (limits), and used to consume CPU and memory after being scheduled to specific nodes. Since there were no resource limits, the node allocated to allocated resources to that pod, and the system threshold was limited.
, the node in response between kubelet and container runtime due to a combination of CPU usage, lack of memory, and process schedule, and the cluster did not receive a response from this node, and the node switched to the NotReady state after a certain period of time.
The cluster's controller deleted the pods that were running on the nodes in the NotReady state and reschedule them to new nodes, but they also had no resource limits, and the newly deployed nodes also lacked free resources. As a result, the resource considerations of the reschedled pods were affected, and those nodes were also significantly overloaded.
Interventions, resource exhaustion that effort on one node spread the load to other nodes through the pod relocation process, and service response delays, some application timeouts, and internal communication failures caused as many nodes switched to the NotReady state.
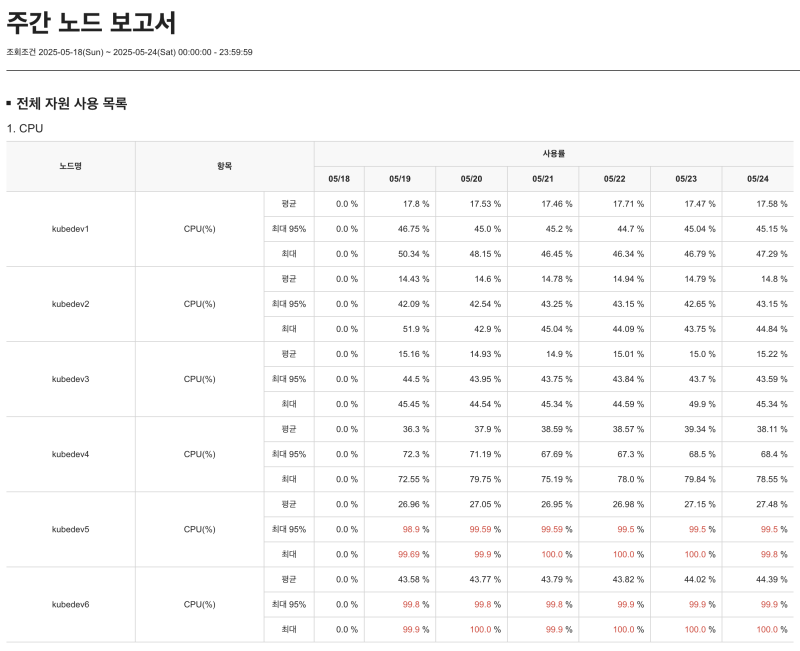
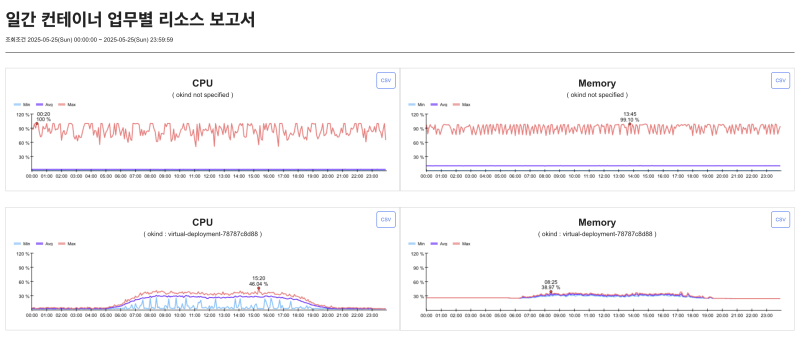

As a result of this, the monitoring tool's Resource usage reportsWith matrix chartI started using it on a regular basis. By considering nodes with useful resources for testing, it was possible to identify the application's resource usage by time period and peak figures measured to normal times, and an appropriate request/limit value was set based on this.
For example:
- Average CPU usage: 250 m
- Max CPU usage: 900 m
→ Request: 300m, Limit: 1Adjust to
2. Batch Job Resource Scramble: Solved with the 'Pod Startup Analysis' Feature
Another example was an environment where batch applications were attempted run. The deployment took as short as 2 minutes and as long as 10 minutes, and it was also running without resource settings. The cluster was overloaded as multiple jobs were running, which meant some jobs to wait or file.
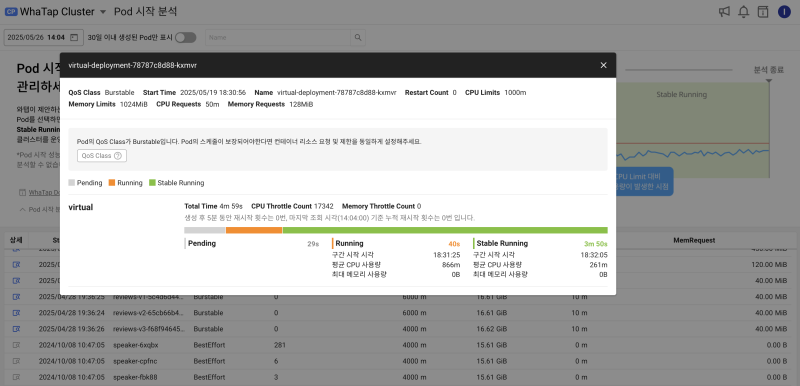
To solve this problem, the monitoring tool's [Pod startup analysis] I took advantage of the function.
This feature visualizes resource usage trends for 5 minutes immediately after the pod was evaluated, and provides data including the initialization container and the time of first load. Based on this, we improved application performance and adjusted scheduling so that Pods are distributed when jobs are run.
Furious, the Following Appropriate Resource Values were derived and applied.
- Initial 1 minute: CPU burst 800 m
- When stable after that: stay 200 meters
→ Request: 300m, Limit: 800mAdjust to
As a result, more batch jobs can be done at the same time.
3. What if I can't finish the arrangement? Identify issues with the “Pod Timeline” feature
This case happened in an environment where the same batch job was expected., the work took longer than expected, and the next batch started before the batch was completed, the number of pods to increase exponential.

This problem is the monitoring tool's [Pod timeline] I was able to recognize it quickly through the function. This feature shows whether pods are created and terminated in a bar graph for each time period, and helps you compare difficult batches.
By removing on each bar, you can check the measured pod's CPU usage, memory usage, and even throttle status, so we were able to perform the following tasks.
- Adjust the batch execution cycle
- Resource limit increase
- Limit the number of batches that can be won
4. Container summary analysis: Easy to understand even if you're not an expert
Finally, presented for all of the examples [Container summary analysis] I would like to finish this post by considering the features.
If you're unfamiliar with Kubernetes or are in the early stages of suffering, it can be familiar to know what to check in a container or pod. Using the Watap Kubernetes [Container Summary Analysis] feature, it intuitively summarizes resource usage patterns, error rates, and status changes across the entire container, and helps you easily identify the cause of the problem and improve it.
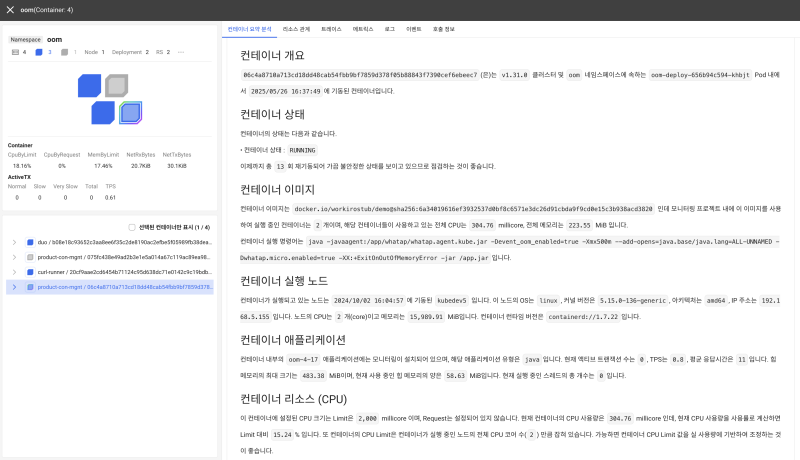
For example, you can check the following items at a glance:
- What containers often throttle
- Is the restart frequency abstract high
- Did you leak the memory at a specific time
- Are the CPU or memory settings excessives low consumption to the average usage rate
A Kubernetes cluster is a complex platform that involves more than a dozen processes and functions. Even if you're new to the problem, it's not easy to even solve the cause of the problem, but you can quickly and easily solve problems in complex Kubernetes environments by using the Container Summary Analysis feature.
While tying
Kubernetes is a flexible and powerful platform, but requires resource settings to incur costs and lead to service failures due to unplanned loads. Remedies, resource settings are very important, and by monitoring and maintaining them, service stability and operational efficiency can be improved.
The Watap Kubernetes team is implementing various monitoring and analysis measures so that customers can operate services. Check the resource usage status of currently running Pods using Watab Kubernetes. With reporting and analysis capabilities, you can get one step closer to more stable cluster operations. 😉