.svg)
Share
Copied!


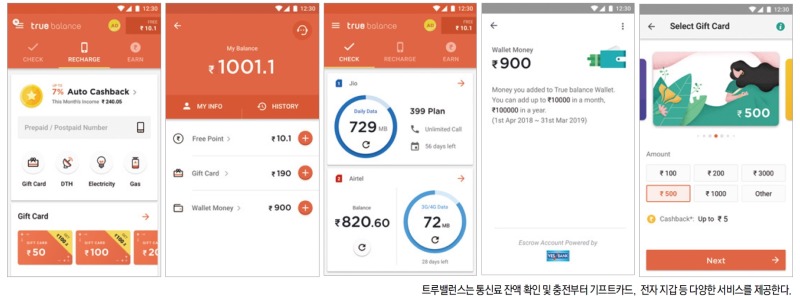
The fintech app “True Balance”, which is used by Indians in the country with the largest population after China, is a fintech platform that can check and charge the amount of remaining data and remaining calls, with a focus on balance inquiries.
In Southeast Asian markets such as India and the Philippines, average smartphone sales per subscription (ARPU) are low, and prepaid billing is being operated. Unlike the method we know before, India uses a method called “USSD” for balance inquiries.
Since it is difficult to measure call volume and data volume, the user directly calls or sends a text message to the carrier using the USSD Code to receive a reply with information about the balance. To eliminate this hassle, True Balance has developed a service that allows you to easily view remaining call volume and data volume.
The results were proven numerically. The year after launch, the number of downloads surpassed 10 million, showing the fastest growth among Indian fintech companies.
Balance hero Jang Gil-soo, who participated in the interview, has been running the service with Wa Tap since the beginning of the service. For that reason, I was impressed by the feedback and concerns about Watap products. We met Jang Gil-soo and Han Davit, who are in charge of the DB and server, and talked about how to operate and manage the service with Watap monitoring.
Please tell me about the state of IT infrastructure.
Jang Gil Soo (hereafter Gil Soo): The entire infrastructure uses AWS. Since it is a company that provides services in India, there are no servers in the Korea region, and major services are concentrated in the India region. With the exception of DR, I'm using AWS.
Please tell us about the background behind the introduction of WhaTap.
Gilsu: We introduced Watap 5 years ago. I remember that the Watap service had just started at that time. We had no experience with any other APM, and we needed an APM that was a little easier and lighter to start. At the end of the day, Watap was an early stage, so it was a simple product that was easy to install and only essential features could be viewed without any settings. It was a product that was right for our eyes, and they actively supported us at the beginning.
Please tell us about the advantages compared to other products.
Gilsu: In the case of a DB, it's easiest to first come out with all the basic settings. After that, the agent method may feel different from user to user, but even if you don't use any technology, simply install the agent and connect to the DB, most of the monitoring will be collected, and then the necessary graphs will be displayed all at once through the web page. If you look at it simply, it's easy to install and simple to use. In the case of other APMs, the process from installation to setting up is difficult, especially since it is easy to install but difficult to set up. There are so many menus to do what I want, but in the case of Watap, I think I finished everything from installation to configuration, or monitoring, and installation process when I didn't know anything at first, and I finished it within 30 minutes to 1 hour.
Han David (hereafter David): I used a demo (Demo) when using APM, but I've never actually used any other APM. However, when I was trying to demo other products, I often faced difficulties. This is because the settings are too extensive, and you have to do everything in detail to get the desired results. However, I also used Watap for 3-4 years, and there were almost no settings at the beginning, and there weren't many settings I could change. Recently, WaTap also has more features, so it has become a bit difficult. Still, isn't it relatively comfortable... I think it's easier to access than Company D or Company E APM or anything like that.
What is the most viewed Watap service screen?
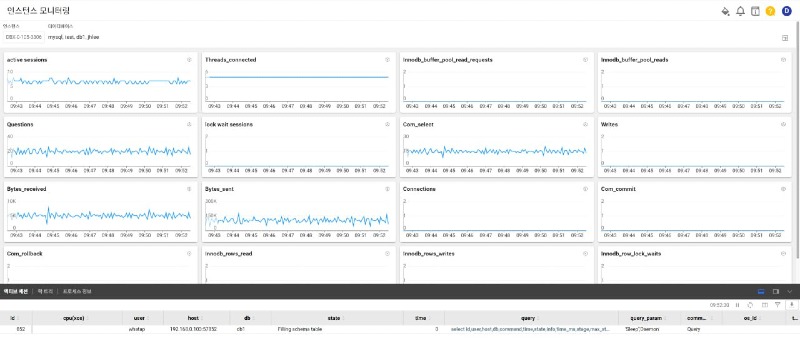
Gilsu: DB sees a lot of instance monitoring pages, flex boards, and almost graph-based services. Next, Instax monitoring now has active sessions. The most common thing I see is that queries are being processed in real time.
David: I'm looking at a lot of heatmaps in application monitoring. Once I got used to the heatmap pattern, it seemed a little easier to understand what kind of issue this was. For example, there is a red line of 3 seconds hanging all the time. I'm watching it because it's easy to figure out where the thread about it is hanging. There are various queues on top of that, even if we actually missed them before, so there are some that are stored in a cube, so it's much easier to go into that cube, look back at the contents, grab the right pattern, and track the issues that occur as a result of the pattern, so I'm watching that kind of thing.
We've recently started using server monitoring, and the good thing is that we use Javix for server monitoring, and it's not easy to check which process is using how the CPU or memory is being used by setting a specific point in time. It's hard to check Javics, other Redis, or monitors like this.. However, since Watap server monitoring keeps a historical record of server resource usage, it is possible to determine whether an application actually operated and written by Java is actually using the CPU or memory at that point, so I'm looking at a lot of the CPU and memory parts used by the process.
Have you ever solved a problem while using Watab?
Gilsu: There are no major issues these days, so rather than dealing with the fault, I usually check the instance monitoring frequently when an issue occurs and when tracking issues. No matter what API you look at, whether it's Company P or Company D, it often focuses on graphs when monitoring instances.
Of course, you can view the query, but in the case of Watap If you click Total Runtime to monitor an instance, the executed query is displayed along with the graph. If values unrelated to the query go up, it is possible to identify at once that a problem other than the query's problem has occurred. So I think being able to watch them all at once is an advantage. When XOS is installed, process information is also displayed, and lock information and DB related information can be viewed on one page. If slow queries come in in in large numbers, or if a query is locked due to changes, such things must be identified from various relationships. I'm constantly checking so that I can look at it in a minor state and make quick decisions and take action before going to a large number of major failures. In fact, once a DB fails, it's a big failure. So before that, we need to understand and take action in advance, so we continue to monitor in real time.
What features helped you the most while using it, and have you ever used Watab to shine?
Active transactions and heatmaps of processes that act as gateways at the center of the service were very helpful. This is because I was the first to notice a major failure (full service unavailability). It was helpful to be able to identify which transactions were being pushed, track the cause, and resolve the issue. Also, statistics on transaction errors are provided for each class, and when some failures (some services are unavailable) occurred, the developer did not leave an error log, so the symptoms could not be identified. I was able to find out the symptoms through WTAP's menu, and I was able to find the cause of the problem and solve it.
Gilsu: In the case of DB, I'm receiving Watap warning alarms on Slack. I check on Slack when a problem occurs, so I'm not watching the monitoring screen, but it's like monitoring 24 hours a day.
David: In the case of application monitoring, I'm watching a bit too much. I'm also looking at system performance, but I'm also looking at it to collect metrics and errors from our APIs. What is the pattern and how is it happening, because our service itself is a third party in India, so if the integration occurs in India for several hours, it often takes a timeout. We distribute almost every day, so we watch that time frame unconditionally. Even if it's deployed by an engineer other than me, I'm still monitoring it, so I think I'm watching for an average of 3 to 4 hours a day. I also receive notifications on Slack, so I check for alerts as soon as they occur.
Frequently viewed features in DPM
Frequently viewed features in APM
Gilsu: In the case of channel talk, the answers were detailed and detailed in real time. Also, the unresolved issues were directly linked to the engineer via email, and the answers were detailed and well received. In the case of technical support services, I am satisfied with the excellent support.
Gilsu: For startup companies, I think it's worth trying out. You might be wondering what to use for monitoring, but rather than a complicated and large APM, I recommend Watap, which is easy to start. It's not complicated, it's simple, and the support service is very spacious, and they are very friendly and responsive. 😊