.svg)


In this post Wattab.net monitoringLet's take a look at how to monitor and debug the performance of. Net desktop applications using. Currently, Watab.net monitoring is only available on the. Net Core version, and will be expanded to the .net framework version in the future.
usage
First, you need to install Watap's. Net monitoring agent. For more information on how to install, see Official documentYou can check it out through the Nawatap support team. In this article, instead of the installation process, we'll assume that an agent has been installed.
Since performance monitoring basically works in a WAS environment, desktop applications must also be included in the monitoring scope through environment settings as shown below. Therefore, before running the desktop application, you can run it in the following order.
Let's assume the monitored application is named WinForm-monitoring.exe.
You can use the other items as is, replace only the WinForm-Monitoring.exe part with your own application file name and run it in the console.
Why do you need custom traces
Although basic data collection is possible with the above settings alone, it is difficult to obtain as detailed information as a web application. In this case, you can use System.Diagnostics to generate events and forward them to performance management tools to monitor more detailed information.
You can trigger the event directly, but you can implement it more conveniently by copying the code below into your project.
The most basic unit of monitoring is a trace (transaction). A trace can consist of multiple steps (steps).
For example, let's say you're calling an API called “/api/users.” This call is treated as a trace and displayed as a single dot on the heatmap on the monitoring dashboard.
The backend code that processes the API can use a database or Redis as needed, and each of these processing details is processed in one step. If the SQL is executed 10 times to process an API, 10 steps are displayed on the monitoring screen within a single transaction.
However, in desktop applications, the criteria for automatically distinguishing traces are unclear. Therefore, the developer must specify which part of the code is the beginning and end of the trace.
How to use custom traces
Once you've copied the WhatapDiagnostic class into your project, you can run the following methods to generate custom traces and steps.
Note that performance monitoring basically takes into account the environment running in WAS, and the display method also appears as if it were running in WAS.
WhatapDiagnostic.traceStart (“test.desktop”, “button1_click”, “”);- Shows the starting point of the trace.
- parameters:
host: It doesn't have much meaning on a desktop, but it can be used to distinguish between application types.
url: Used to distinguish between actions currently being performed.
userId: If you need the number of concurrent users, you can enter a different string for each user.
WhatapDiagnostic.traceStop ();- Shows the trace end point.
whatapDiagnostic.setException ForTrace (ex);- Use if an error occurs during tracing.
WhatapDiagnostic.userLog (“button1_click start”);- It is used to keep user logs.
WhatapDiagnostic.stepStart (“Step1");- Shows the starting point of the step.
- parameters:
message: Enter specific information about what steps were performed.
WhatapDiagnostic.stepStop ();- Shows the end point of the step.
- Shows the end point of the step.
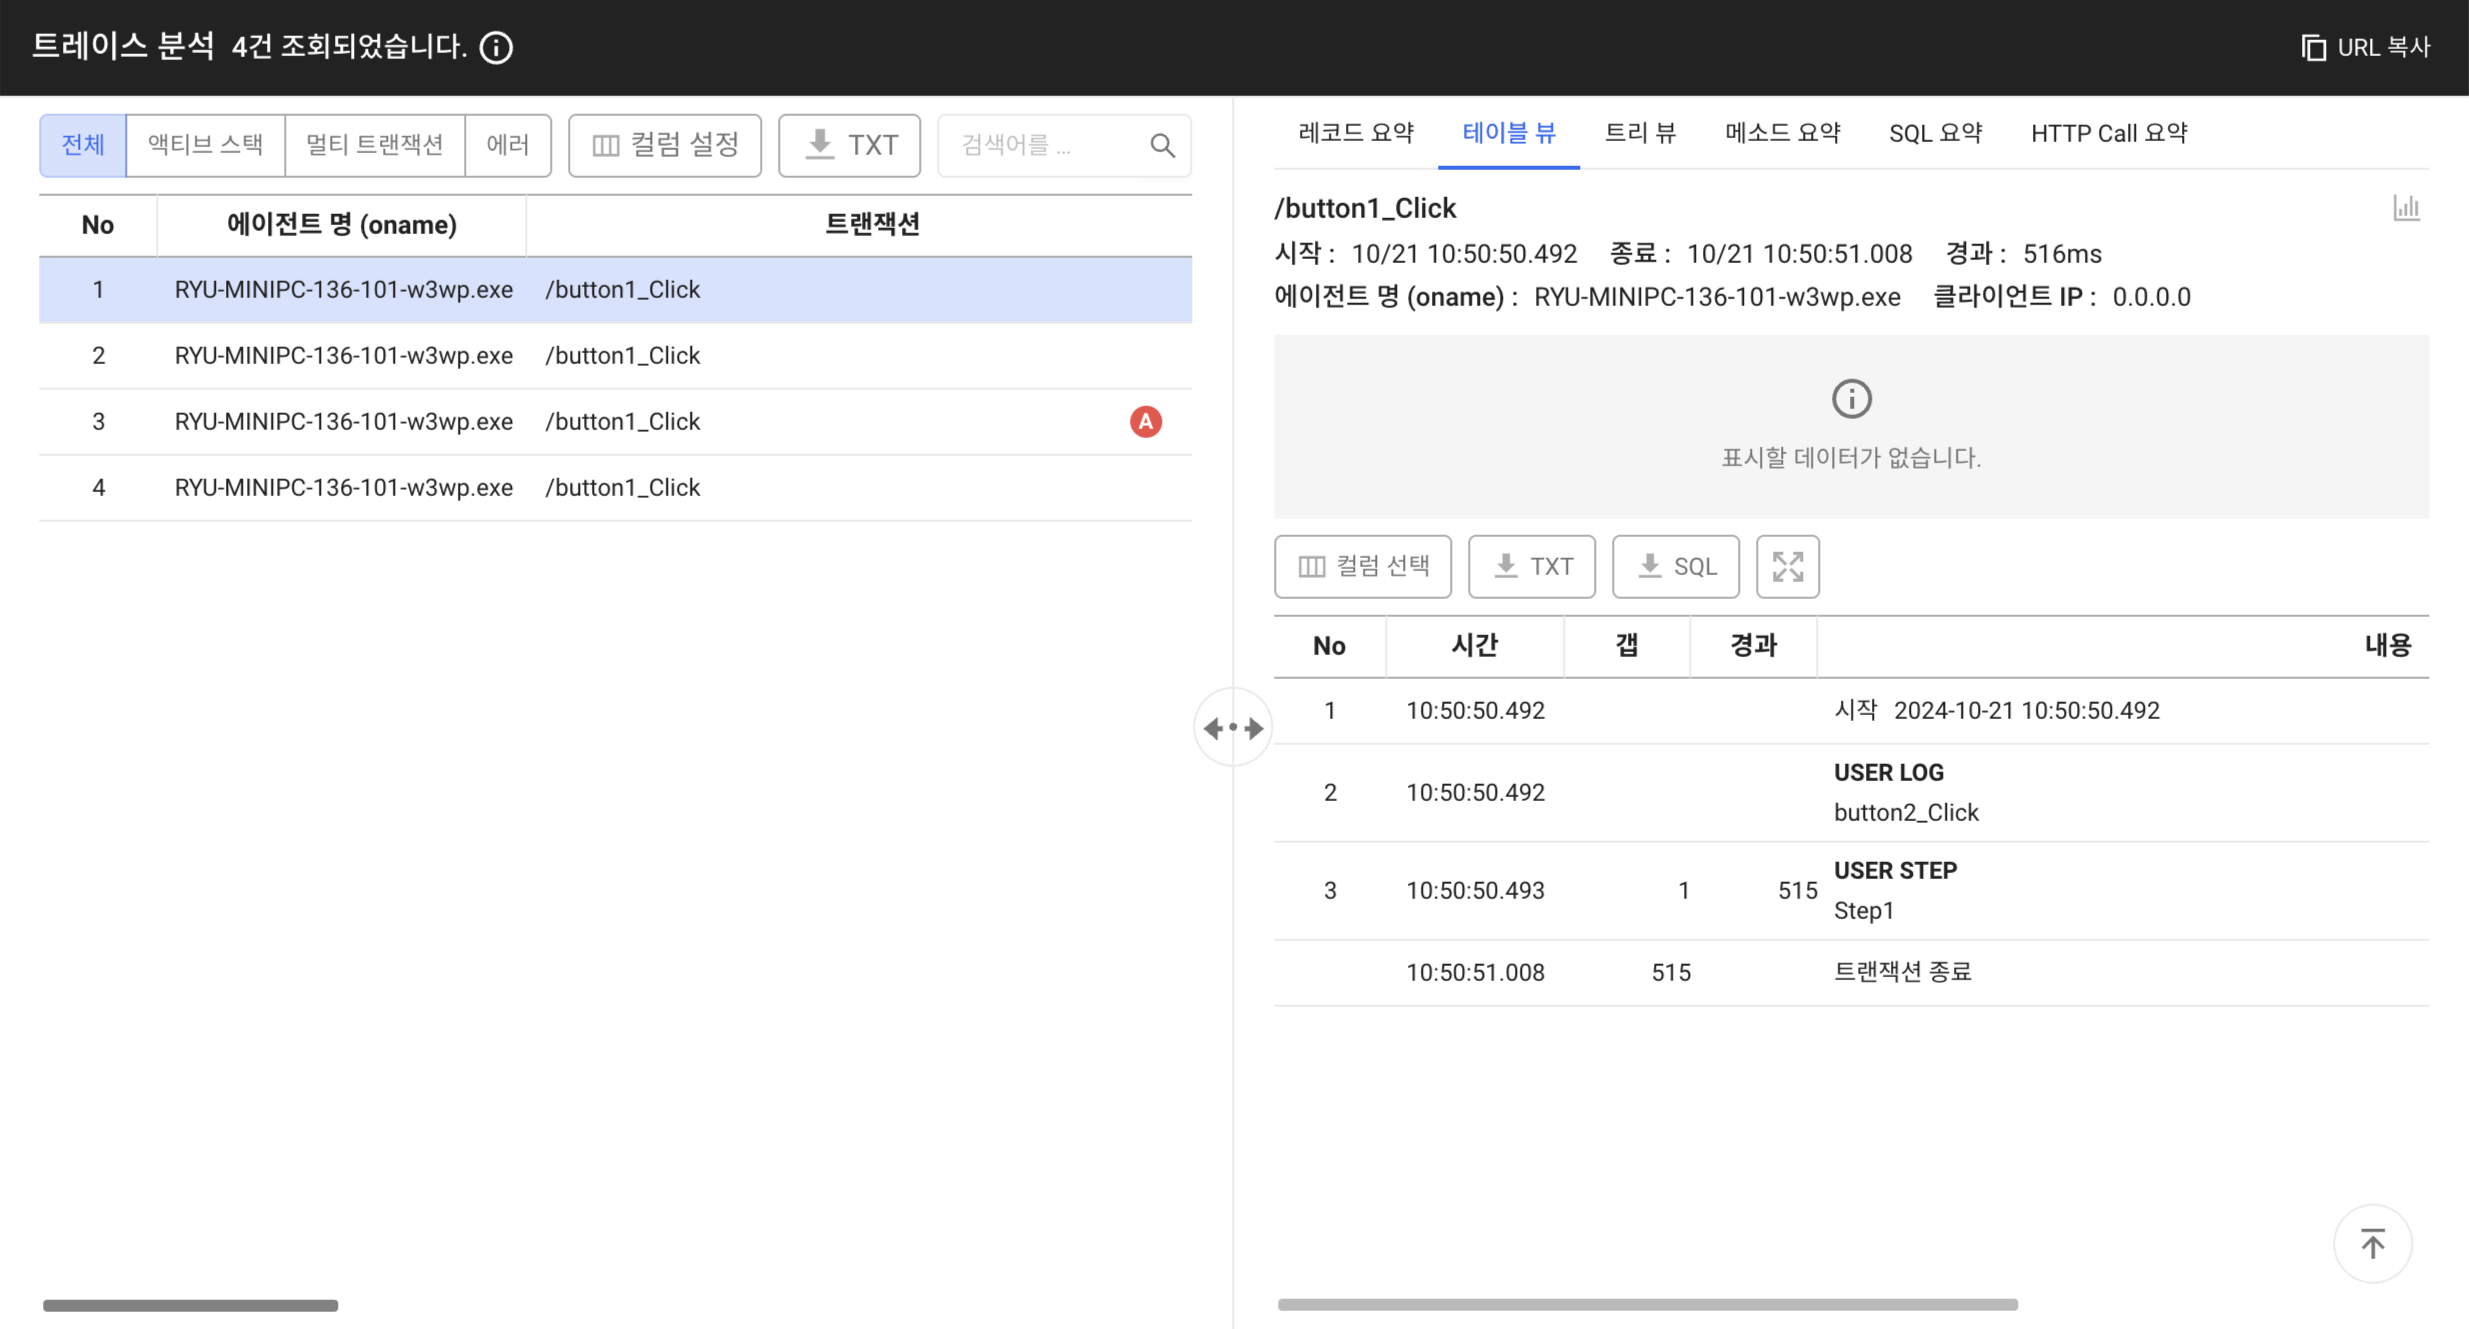
The following image captures the monitoring results. Since there was a 0.5 second delay between the start and end of the step, you can see that the elapsed time is displayed as approximately 0.5 seconds.
Examples of automatically monitored targets
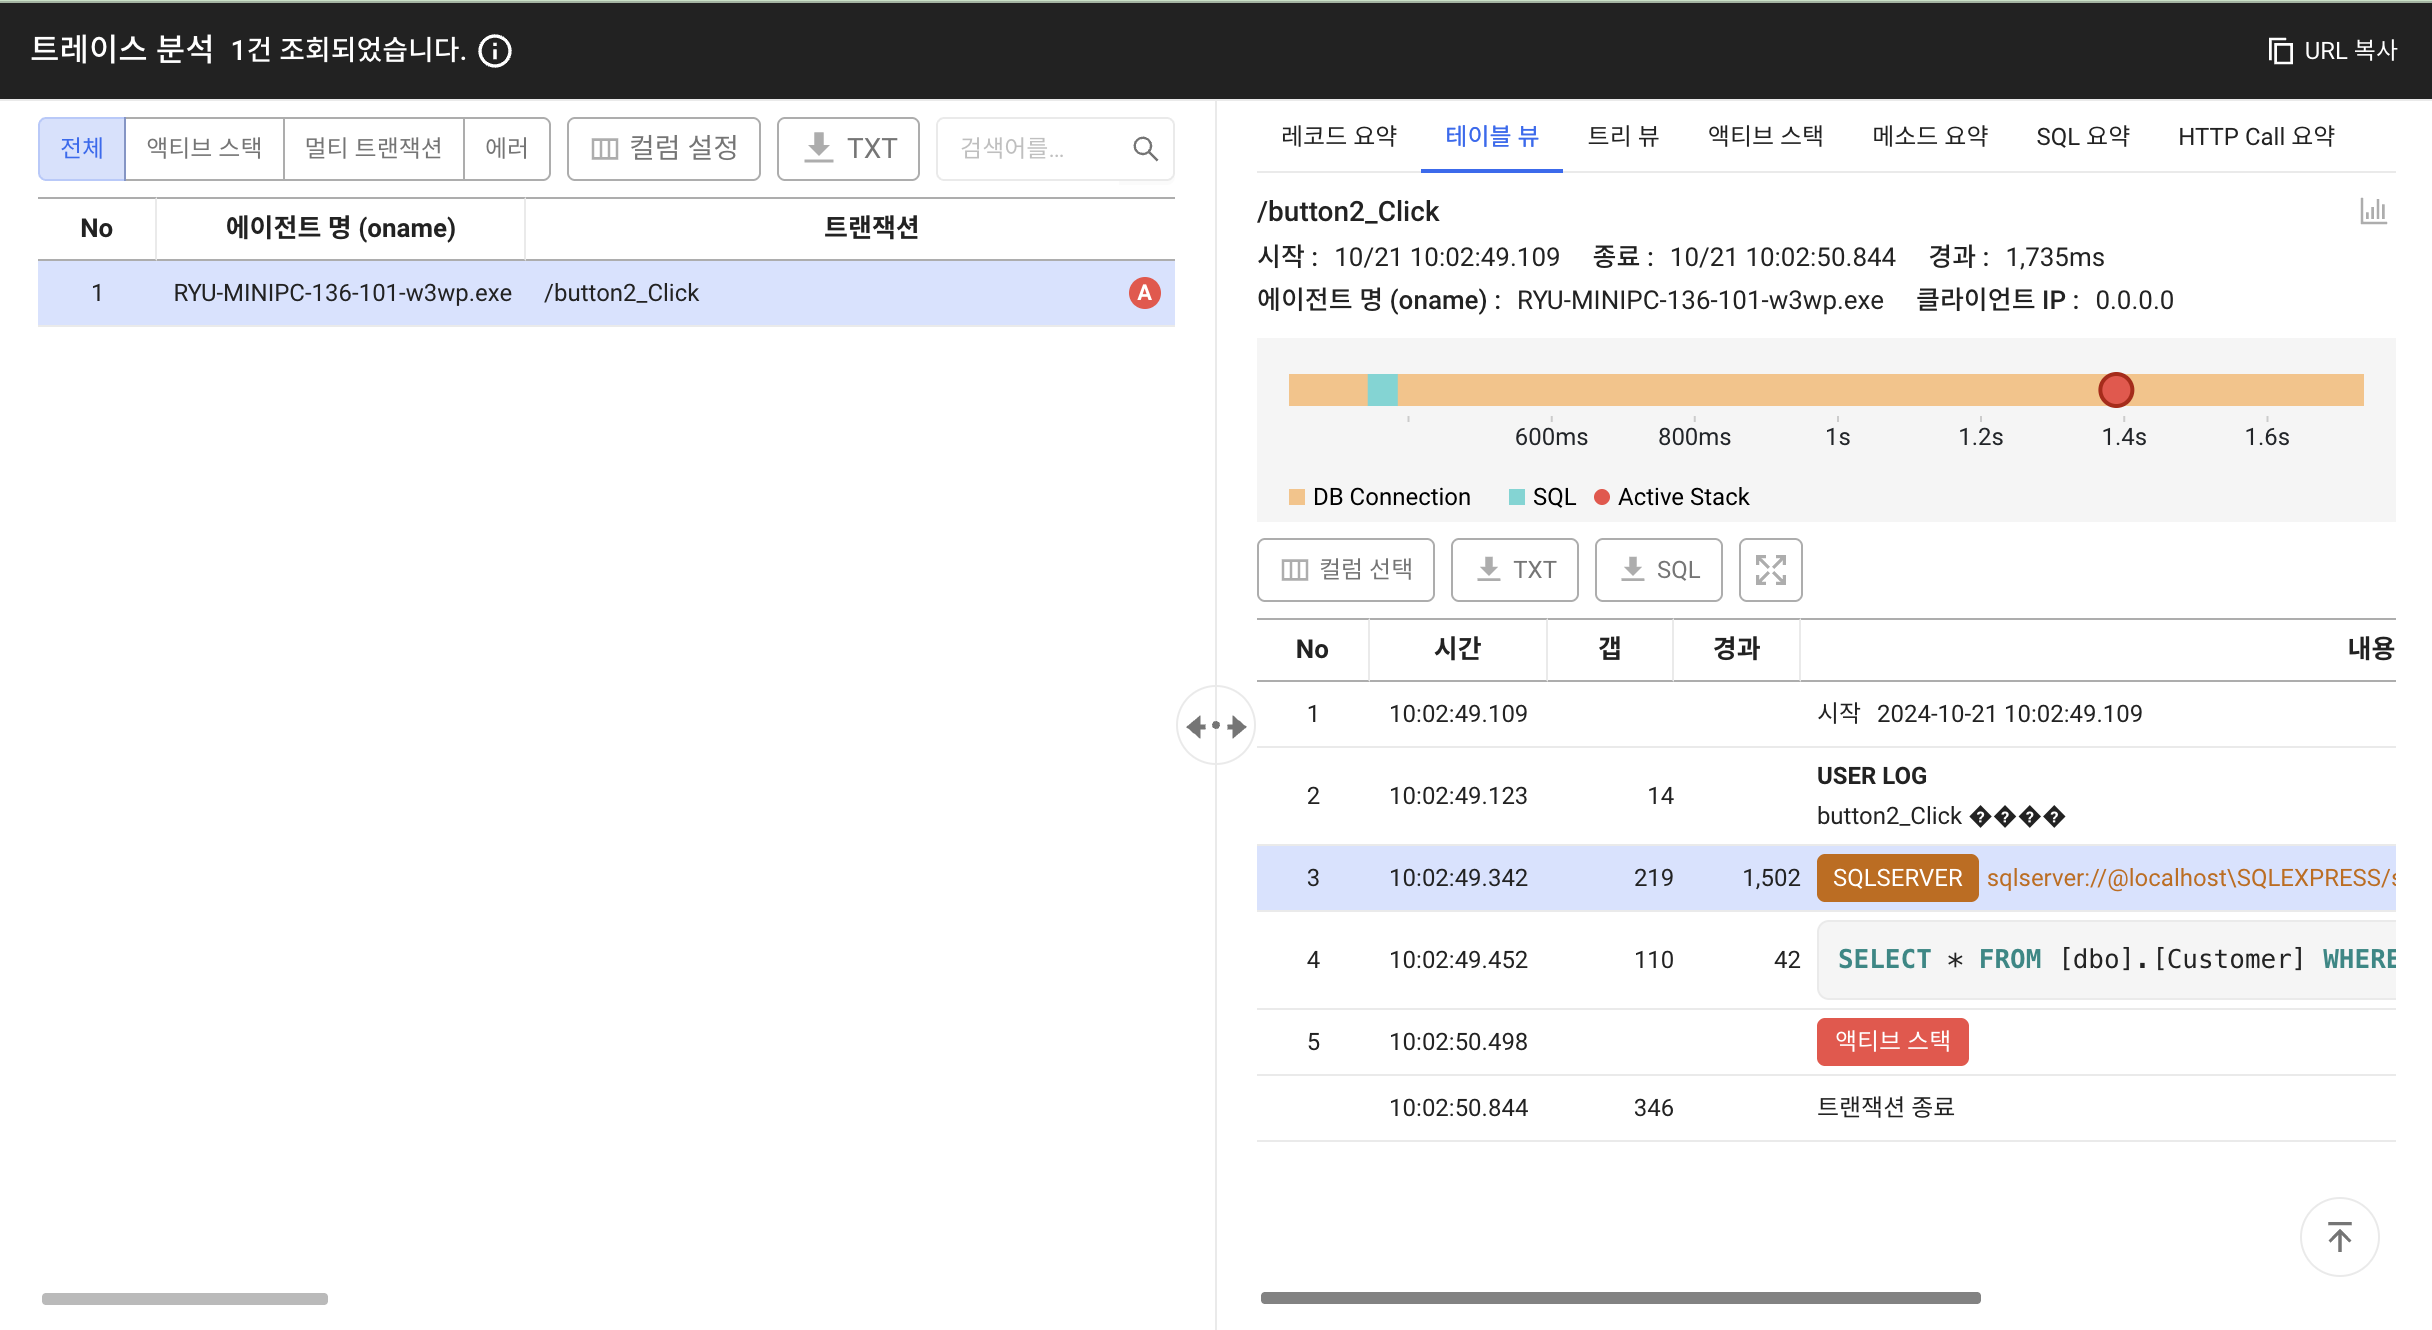
The code below is an example of using database-related code within a custom trace.
The following is an image of the monitoring results for the above code. You can see that database server connection information and query calls are automatically monitored.
finishing
In this article, we learned how to monitor and debug the performance of. Net desktop applications using Watap's. Net monitoring agent. By gathering detailed information through custom traces, you can improve application performance and quickly find issues.
Also, since the scope of support will be expanded in future versions of the .net framework, more efficient monitoring will be possible through continuous updates. Use Watab to further improve the stability and performance of your application.