.svg)


Implementing a smooth and responsive UI in Android app development is an important factor that determines user experience (UX). Rendering performance becomes more important, especially in environments where different devices and resolutions must be supported. In this post, we'll look at how to analyze and optimize the rendering performance of apps using Android's HWUI (Hardware UI) rendering engine.
What is HWUI?
HWUI, which I'm going to introduce in this post, is an engine that renders UI using hardware acceleration on Android. It helps to efficiently process complex view hierarchies and animations through collaboration between CPU and GPU. If you analyze HWUI's rendering profile, you can check various information such as:
- Frame rendering time: You can check the total time it takes for each frame to be drawn on the screen. (For example, to maintain 60 fps, it must be processed within approximately 16 ms)
- Rendering pipeline step-by-step time: The time spent on each step of layout, drawing, and compositing can be measured, which is useful for identifying bottlenecks.
- CPU and GPU task separation time: It can be analyzed by separating the time the CPU prepares UI data from the time the GPU actually renders.
- Overdraw (Overdraw) Status: You can optimize unnecessary drawing tasks by checking when multiple drawings occur on the same pixel.
- Rendering commands and layer information: Provides information about whether certain UI elements cause excessive drawing commands or create complex layers.
Rendering analysis using HWUI does not provide detailed enough information to determine the cause of the problem in detail, but it has the advantage that it can be performed without a separate agent or additional tool. If you only need an Android phone and the app you want to analyze, you can check it easily, and since the process is not difficult, even non-developers can easily display the HWUI analysis screen.
Enabling HWUI
To enable HWUI, you have to enable developer options by default. If it's not on Settings - About phone - Software information - Build numberTap multiple times to activate developer options.

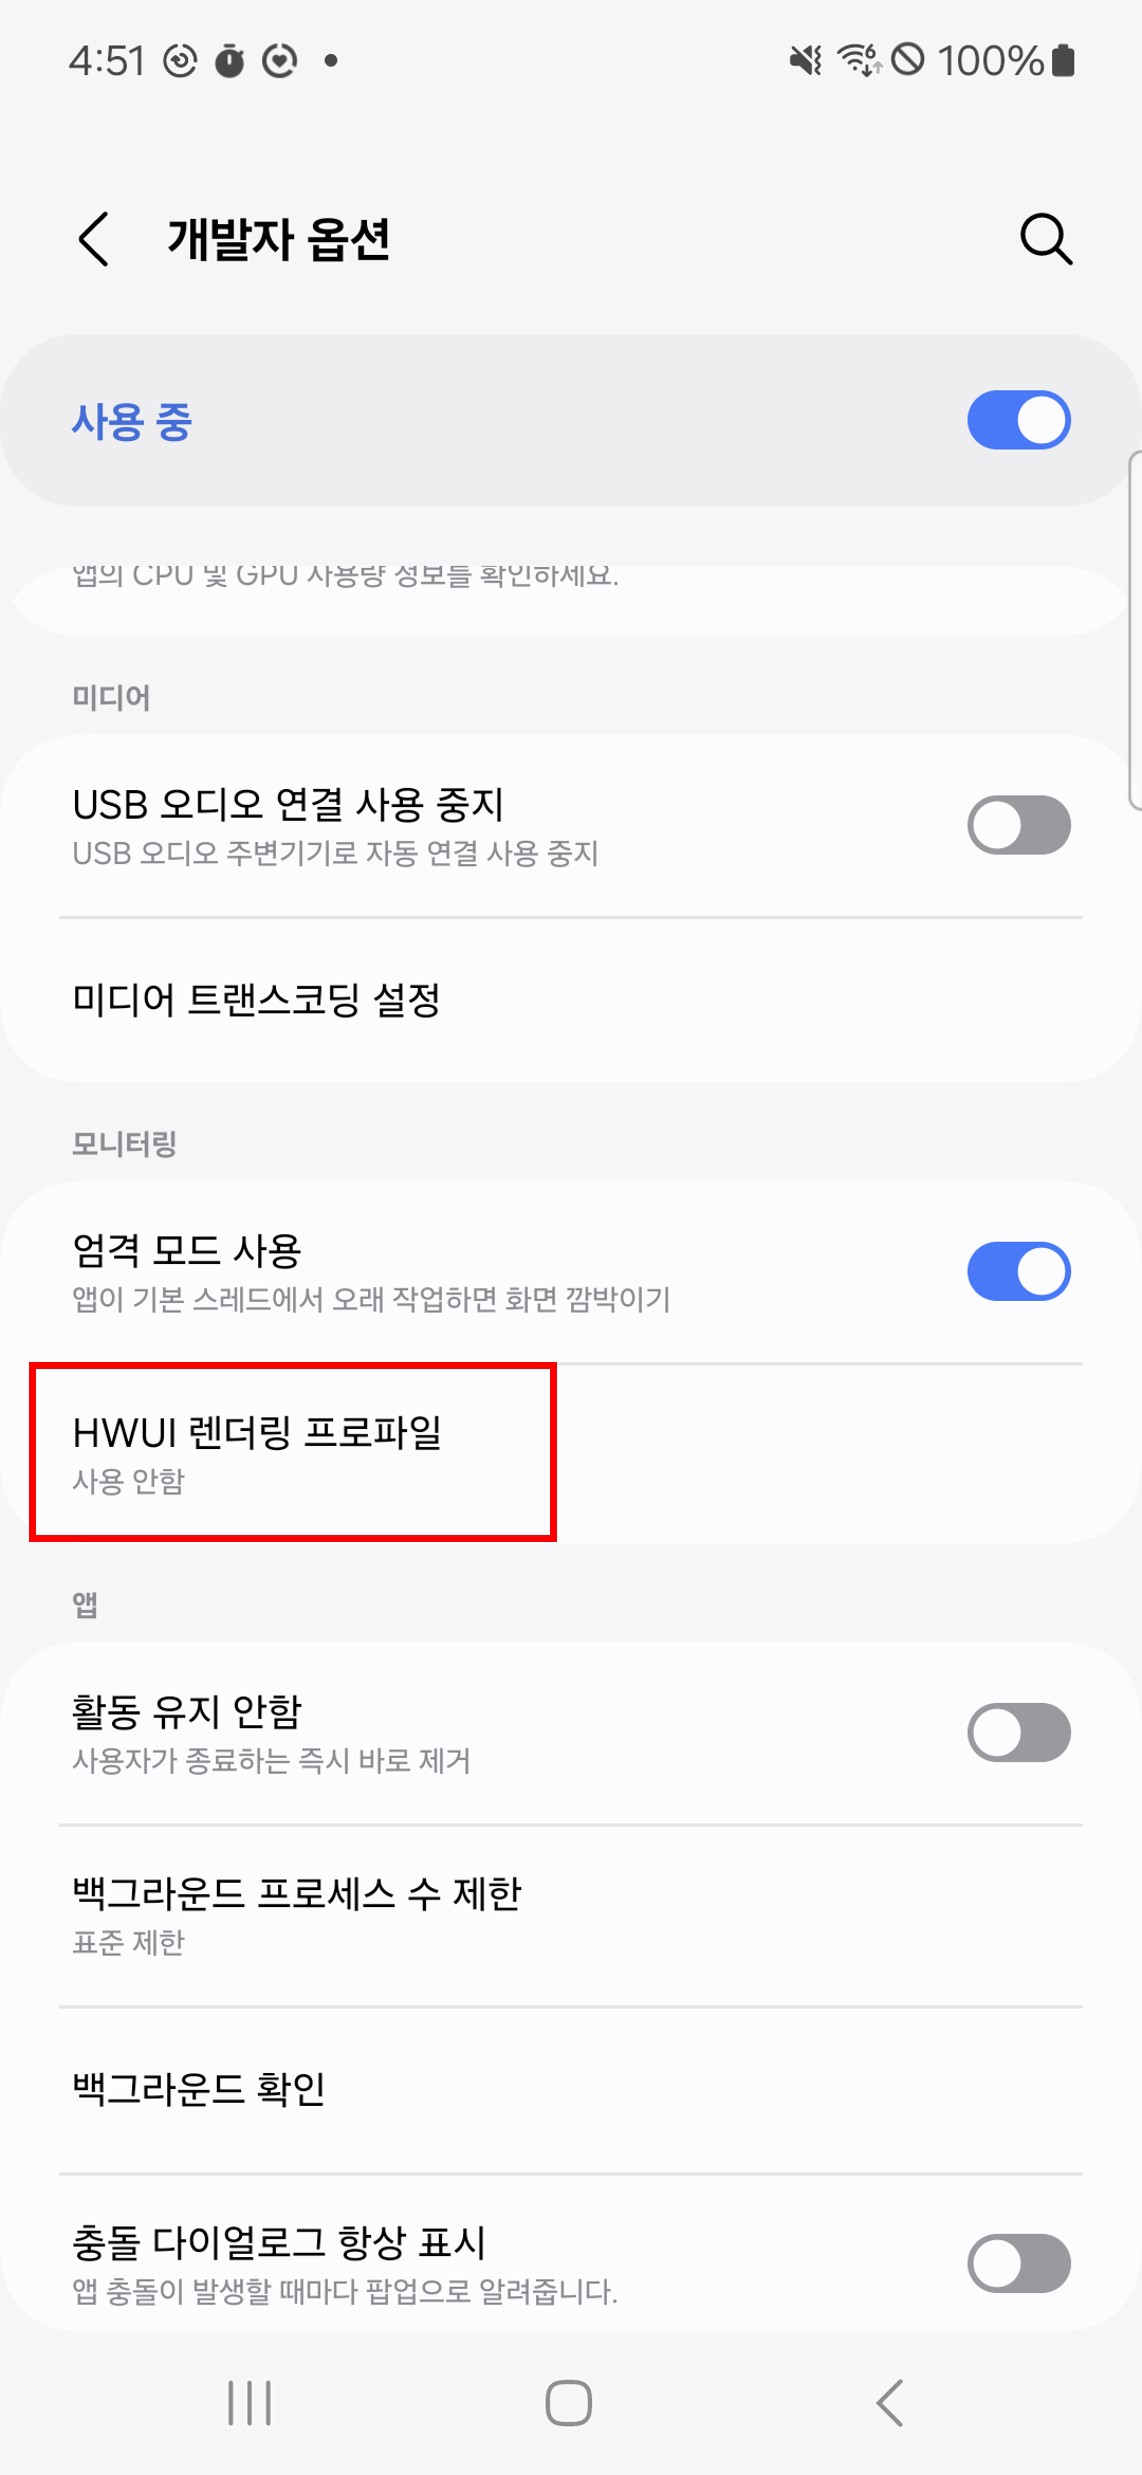
A menu that wasn't visible when it came up in settings Developer optionsHere it is. If you go to the menu and go all the way down HWUI rendering profile I see a function called
On the screen after selecting the appropriate menu Show as a barIf you press the button, you can see the following graph.
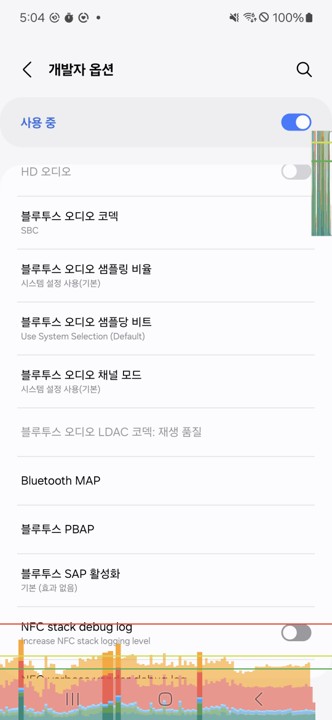
In addition to the app, HWUI's analysis results will be displayed on the screen in real time on all Android screens, including the main screen and settings.
Understanding GPU rendering profile overlays
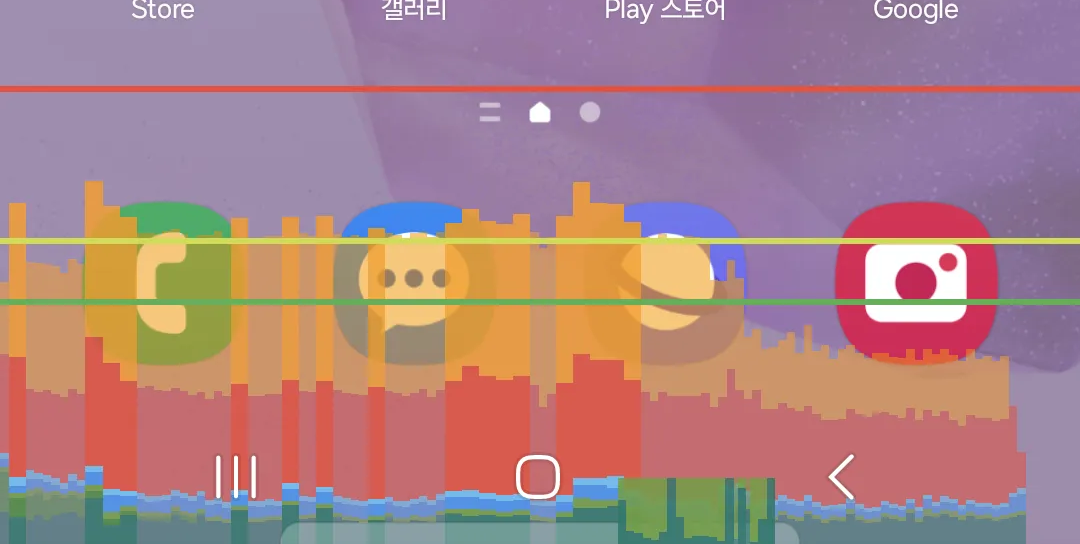
If you switch the screen several times, you can see how the various colored graphs are updated in real time. This is a process of analyzing rendering performance using HWUI. However, to use HWUI effectively, you need to understand what the colors on the graph mean. The Google Guide explains the meaning of each color as follows.
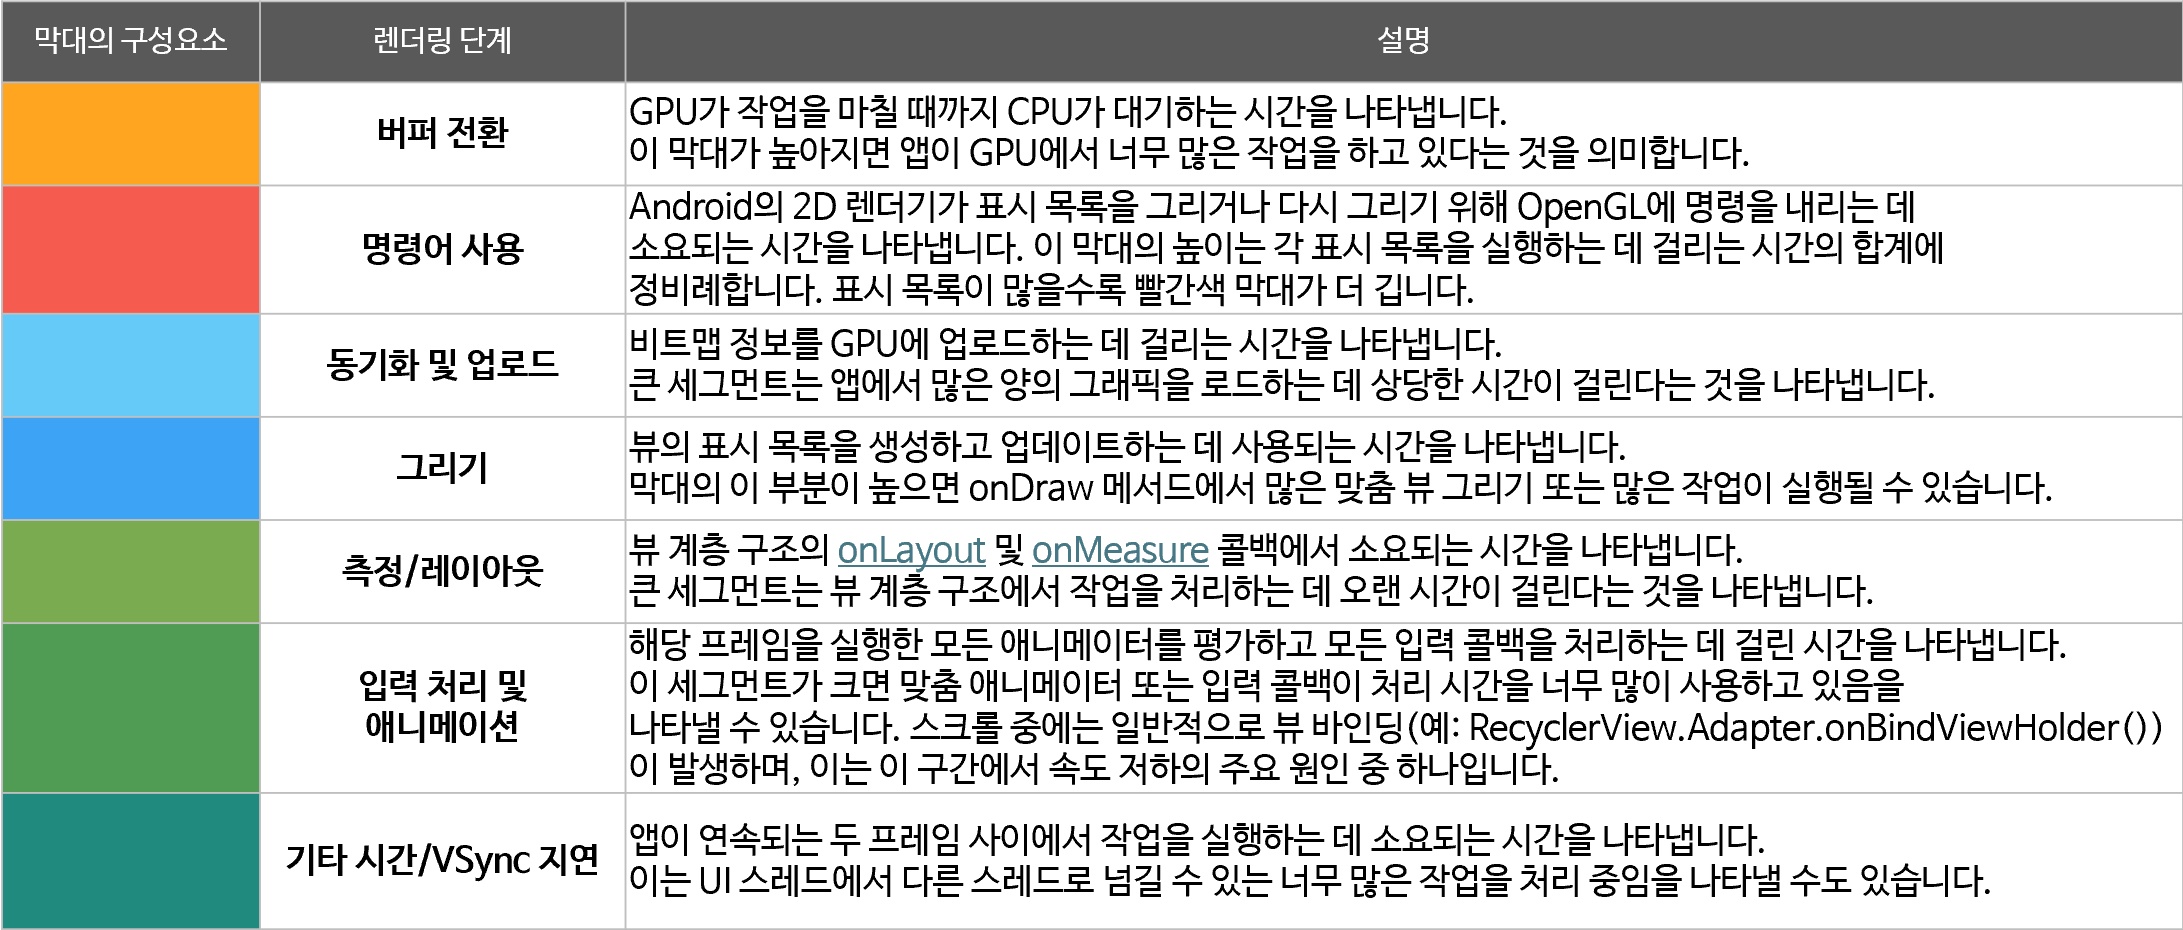
* onLayout (link), onMeasure (link)
If you check the colors one by one, the screen may change quickly, or the graph you were looking at may be pushed out and disappear after a few seconds. For easy analysis, it is more convenient to analyze the colors by grouping them as follows.
- blue/green area
- signification: indicates that the frame rendering time was completed within the reference time (for example, 16 ms, 60 fps).
- Positive signs: If most of the frames are displayed in blue or green, it means that the UI is rendering smoothly. In other words, you can see that the app's rendering performance is good, providing a smooth user experience.
- yellow/red area
- meaning: This means that the frame's rendering time has exceeded the reference time. In this case, frame drops or rendering delays (jank) are likely to occur.
- Signs of a problem: If yellow or red bars appear frequently in the overlay, this is a sign that many frames are taking longer than expected. This means that the app's UI may not run smoothly, and can be interpreted as a warning that optimization is needed.
In other words, If there is a lot of blue, the performance is good; if there is a lot of yellow or red, and it comes out continuously, there is something wrong, so detailed analysis is necessaryYou can think of it as one case. However, when interpreting a graph, it is necessary to consider not only the color but also the baseline of the horizontal axis. Green, yellow, and red lines are drawn on the horizontal axis, and if the graph is drawn below this line, it can be viewed as providing sufficient FPS. Therefore, it is an effective analysis method to recognize when a graph is drawn beyond this baseline as a problem signal and examine the overall pattern.
If there is a problem, how can I fix it
If you're having trouble with HWUI, it's probably because the GPU is doing a lot of work. We should literally cut down on GPU work.
The first one. Layout optimization The work must be confirmed.It is necessary to reduce unnecessary layouts and reduce layout calculations by constructing efficient layouts such as ConstraintLayout
Second. Animation optimization I have to do it.Complex animation effects or excessive animation effects increase the GPU load, so it is necessary to use it appropriately, and if possible, use hardware acceleration to distribute the workload of the GPU. In particular, during the development process, sufficient testing is required with low-cost devices with low CPU and GPU.
For the third time Manage Jank You have to do it. The guide is that in order for the user to interact smoothly with the app, the app must render frames in less than 16 ms to achieve 60 fps. If there are many frames that exceed this standard, users will experience stuttering or delays (jank). In order to manage this, it is necessary to apply a tool to monitor Jank. If you're in development, it's a good idea to check using Android Studio Profiler or Systrace, but if you're running, you should use a mobile monitoring tool to analyze Jank.
Is the web running on mobile also eligible for HWUI?

Another interesting point is that you can see the results of HWUI rendering not only in the app but also on the web. This image is the HWUI result that appears when connecting to Google. This is the result of HWUI detecting rendering the keyboard and even animations when the keyboard is pressed while going through the process of opening the keyboard and entering the URL in order to connect to Google.
Since HWUI is the device's rendering engine, it shows what occurred when rendering not only apps and launchers, but also browser web and web apps. If your web is fast on PC but slow on mobile, you can check the rendering with HWUI. However, it is recommended to add web monitoring for detailed analysis, and it is recommended to view HWUI only as a rendering indicator.
At the end of the article
In this post, I looked at analyzing rendering performance without any installation using HWUI. As explained earlier, no installation is required, so you can quickly check the performance of your app, but it's a pity that HWUI doesn't even provide a way to analyze the cause when a problem occurs.
Since you can check the rendering performance of all apps installed on your phone, it would be a great experience to directly analyze the performance of frequently used apps. I'll finish this post by hoping you note that after the analysis is over, you must disable HWUI in the developer tools so that the graph does not continue to appear on the screen.