.svg)

What I'm going to introduce in this content is the newly added “APM”Agent-specific resource dashboardsIt's' Since this is a new screen introduced after a long time, efforts were made to improve the degree of perfection through various considerations during the planning stage. I would like to introduce this function in detail with the hope that it will be used more actively in the business.
Java resource insights on one screen
First, this resource dashboard is a feature only available on the Java platform in APM projects. This is because this screen is structured based on Java's Memory Pool data. Please note that agents in other languages cannot collect this data, so currently only Java projects support this feature.
This dashboard uses a variety of data, but The core is Java Memory Pool dataThis is it. It is designed so that you can visually understand how the memory pool changes over time, which areas have high memory usage, and why changes in the Eden Space area are prominent even when GC has occurred.
The most difficult part of designing this screen is that it may have been somewhat difficult for first-time users because the screens that have been provided are structured from the perspective of experienced users. Also, during the analysis process, I felt that the user experience was poor due to frequent movement between screens or excessive pop-ups.
Therefore, in this project, we have a structure that minimizes these inconveniences and can derive insights by comprehensively checking key indicators on a single screen, that is, without users going back and forth A screen where you can quickly determine the cause of the problem in one placeWe proceeded with the goal of creating.

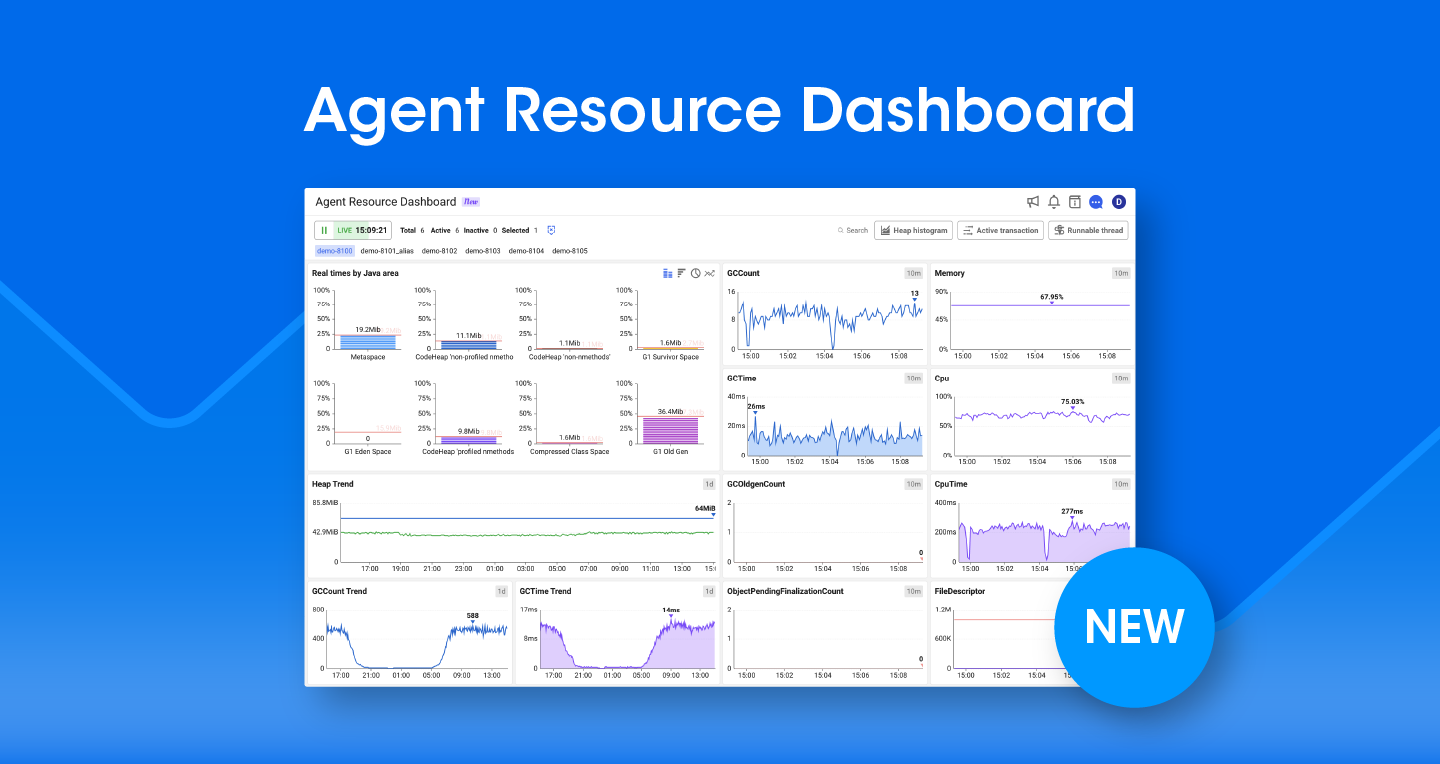
The screen you see above is a newly developed resource dashboard. This screen is designed to be analyzed as a single application unit. Therefore, please note that it is not possible to analyze by project or application task.
Screen design considering visual flow
The following is an explanation of the screen configuration.
The human eye is generally known to move from top left to bottom right when looking at a screen. Considering this visual flow, the 'Java memory area', which is the most important data, was placed at the top left of the screen. Also, the important indicators OldGen GC Count and ObjectPendingFinalizationCount are arranged diagonally so that they follow the flow of gaze naturally.
In particular, the occurrence of OldGen GC is an important sign that a risk has been detected in the system. OldGen GC is called Full GC or Major GC, and when this phenomenon occurs Issues such as 1) Delays in response time, 2) Risk of running out of memory, and 3) Increased CPU usageIt may be accompanied by Therefore, it is very important to prevent OldGen GC in advance, so that system stability and performance can be maintained.
objectPendingFinalizationCount is the number of objects that have not yet been finalized by GCIt means A higher number indicates a large number of GC target objects, which can lead to delays in GC processing time. Also, if this causes a Finalizer Thread bottleneck, it can degrade overall system performance.
If the indicator continuously confirms a high value of 10,000 or more, please check whether to use the finalize () method in the code. If possible, it's a good idea to avoid using this method and perform resource management by clearly disabling resources.
What is a Java memory pool (Java memory pool)?
In Java, a memory pool (memory area) refers to a memory area used by the JVM to run an application, and is managed by dividing it according to the purpose. There may be slight differences between JVMs, but they are generally divided into heap regions and non-heap zones.
Note that there are various types of JDK, such as OpenJDK, Oracle JDK, GraalVM, IBM Semeru JDK, and Azul Zing, and there are differences in the structure of each memory pool.
1. OpenJDK/Oracle JDK Memory Pool Structure
2. GraalVM's memory pool structure
3. IBM Semeru JDK memory pool structure
4. Azul Zing & Azul Zulu JDK's memory pool structure
Key Metrics Widget
- memory
Shows the overall memory utilization (%). Total usage based on internal configurations such as Eden, Old Gen, and Metaspace.
- CPUtime
It represents the CPU time it took for the JVM to execute application code, in milliseconds (ms).
- gcCount, gColdgenCount
gcCountis the number of GCs that have occurred within a given period, gColdgenCountOnly the number of GC times for the Old region is counted separately.
- gcTime
Shows the time spent on garbage collection in ms.
- Cpu
Shows the percentage of CPU utilization of the JVM process.
- TPS
Shows the number of transactions processed per second.
- FileDescriptor
Shows the number of file descriptors currently in use, such as open files or sockets.
- objectPendingFinalizationCount
The object that GC should process finalize () Shows the number of remaining waiting states.
“Realtime Dashboard” description
Based on recent 10 minute trends, various indicators such as current memory changes, whether full GC has occurred, and whether a specific memory area is being overused can be checked and determined at a glance. Also, there are 3 main buttons located in the upper right corner of the screen.
1. hip histogram
- Related information is data in the [Instance Performance Management > Heap Histogram] menu.
- You can analyze the Java class information currently residing in heap memory and search the top 100 classes that take up the most memory.
- If there are classes that take up too much memory, you might suspect a possible memory leak.
- Type description
- If you look at the type, you'll see capital letter I, capital letter Z, [, ljava/lang/string, etc., and I'll explain this part. The part about this type can be understood as a JVM internal representation method. Please see the table below.
- In general, an Object is created and used during development. For example, if the package name is io.whatap.timeUtil, the JVM recognizes it as IO/WHATAP/timeUtil. Most customer-created classes are converted as described, and other types are expressed as follows.
- In Wtab, “/” → “.” to make it easier to view general classes I'm showing it in place of Otherwise, the type format recognized by the JVM is displayed. The reason for this is that it may not have much meaning in general Java development, but It is useful to know relevant type information when doing reflection, JNI, and bytecode analysisThis is because they do it.
- If you look at the type, you'll see capital letter I, capital letter Z, [, ljava/lang/string, etc., and I'll explain this part. The part about this type can be understood as a JVM internal representation method. Please see the table below.
2. active transactions
- The relevant information is data in the Dashboard > Active Transactions menu.
- You can view a list of running transactions and check what tasks each transaction is currently performing. You can check the status of what time it started, how much time has passed so far, and whether the SQL is running or waiting after an HTTP call.
- The reason we need to look at this data together If memory suddenly pops up or CPU usage is high, it is likely due to specific transactions currently being performed That's because. Therefore, verifying this relevant information is essential.
3. Runnable thread
- Related information is data in the [Instance Performance Management > Thread List/Dump] menu.
- When CPU usage is high or response is delayed, it is useful to determine which thread is causing the problem. Also, since they are arranged in descending order of 'thread CPU time', it is possible to check which threads are currently using the most CPU from the time the application is started until now.
- Currently, when CPU usage is suddenly increasing, if you enter the relevant screen and use the thread dump function, it is useful to be able to view the thread information currently being executed along with the stack.
“HISTORY VIEW” DESCRIPTION
Can be viewed for up to 3 hoursIt was developed to do so. The reason for this is that this menu has the advantage of being a real-time dashboard. Therefore, we are planning to provide a minimal history search function and develop a separate resource analysis screen later.
History VIEW is a screen with some concepts of analysis. It is designed so that not only trend data checked on the real-time screen can be queried, but also transaction/SQL/HTTPC statistics data.

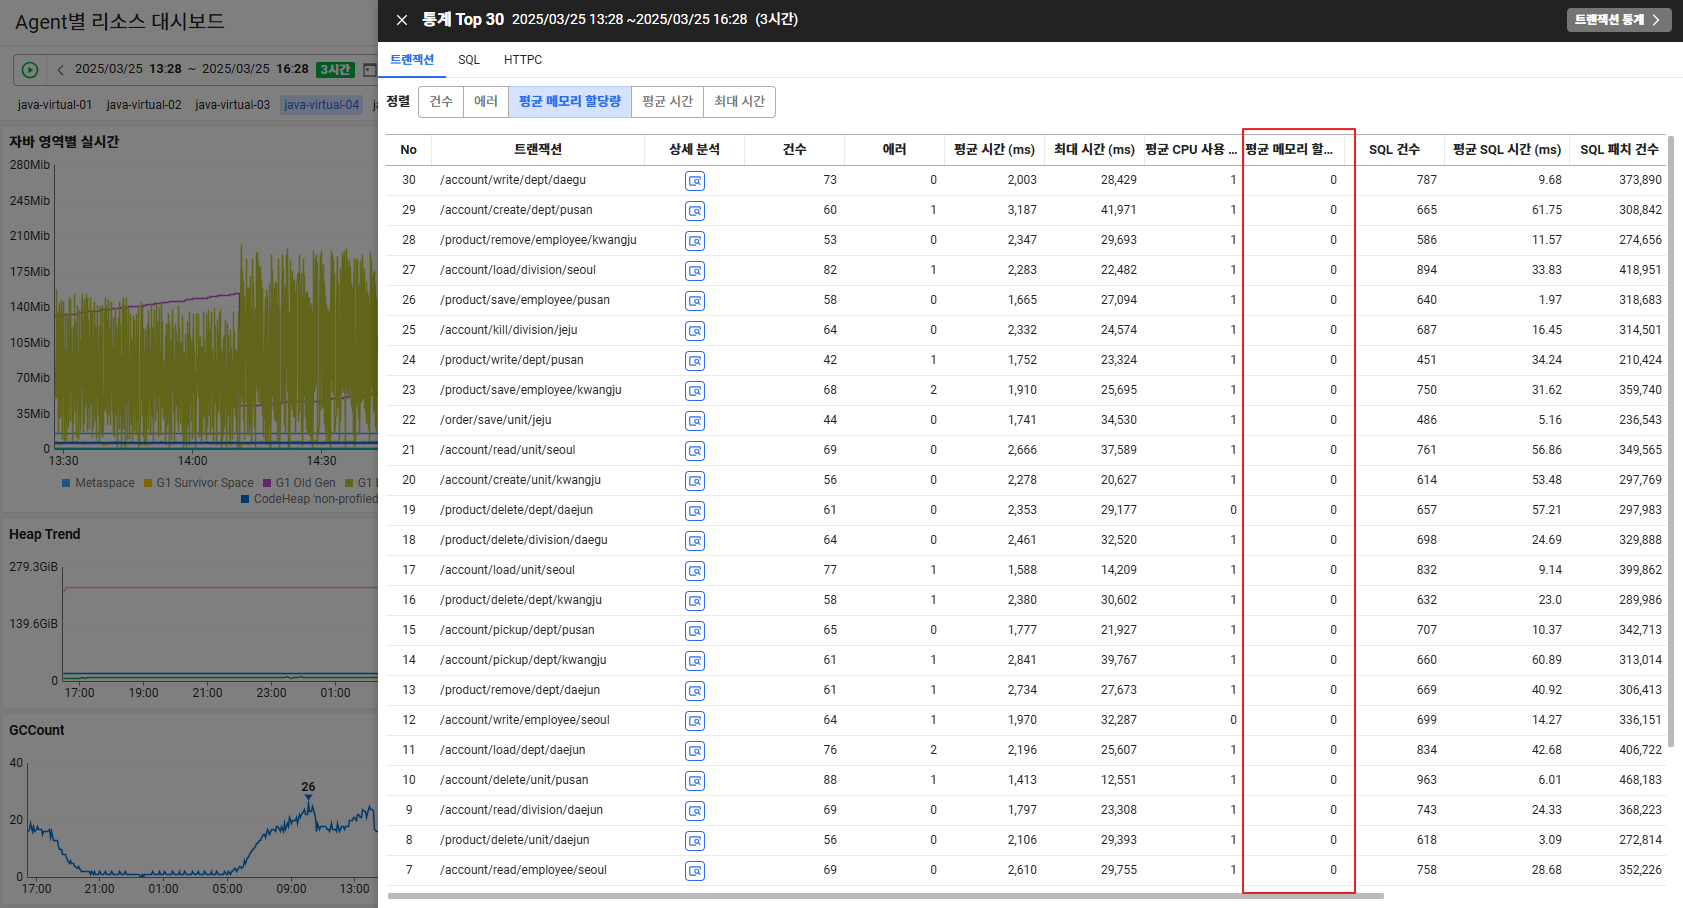
1. transaction statistics
- The relevant information is data in the Statistics > Transactions menu.
- The data itself is the same, but on this screen, you can view transaction statistics performed during the query period with various sorting conditions (number of cases, errors, average memory allocation, average time, and maximum time). The reason for this arrangement is that if the same transaction is repeatedly included in the top 30 items under multiple conditions, the transaction is likely to be the one causing the problem.
- If you don't see an average memory quota value here, you need to check the options. Note, however, that this option is not recommended for applications with too high TPS.
- We recommend using the option with an average TPS of 300 or lessI give it to you
- Option name (default false)
- trace_malloc_enabled=true
2. SQL statistics
- The relevant information is data in the Statistics > SQL menu.
- The reason for looking at SQL is that resources are closely related to Heap memory. Generally, data obtained by calling SQL is used to perform an operation called a “patch.” Patching refers to the process of loading data contained in a ResultSet into memory via Loop. Therefore, a large number of patches means that it is a task that uses a lot of memory.
3. HTTP Call Statistics
- The relevant information is data in the Statistics > HTTP Calls menu.
- When you make an HTTP call, you'll get a response in most cases. Nowadays, there are a lot of related responses in JSON, and JSON also often exceeds in MiB units, so if there are many related calls, Heap may increase due to this part.
At the end of the article
The newly introduced 'Resource Dashboard by Agent' is designed to intuitively understand memory and resource usage in Java-based system operating environments and to catch signs of failure early.
In business environments that are more sensitive to system performance, these resource-based insights are likely to make a big difference in responding quickly and accurately. Using APM's new resource dashboard, we hope you'll have a deeper monitoring experience on a single screen.
Sign up Please check the agent-specific resource dashboard in APM later.