.svg)
.svg)


Did you know that the word blog is a combination of Web + log? A personal site where you record your interests or daily life is called a blog. IT infrastructure is also storing the history of what happened in a day. Logs are a huge amount of records produced in complex, large-scale infrastructure environments with an MSA structure. In this environment, storing and managing logs and retrieving the desired logs when there is an issue is becoming increasingly difficult. Here are some tools that can help you manage and analyze logs at scale more efficiently.
What is a log?
The dictionary meaning of log is "the act of recording something." As we use it in IT, a log is a record of events generated by an operating system, application, server, or network device. Logs contain user input, data about system processes and hardware status, communication history between users and application systems, and other data that allows you to monitor your systems. In other words, logs leave a trail of information across your infrastructure. The method of creating and storing logs for later analysis is called logging. There are two ways to output logs: by storing them manually using a print function, or by using a logging library. Logging libraries are commonly used.
What is log monitoring?
Log monitoring is the process of continuously checking the logs recorded by developers, operators, system administrators, etc. Log monitoring used to be done by manually accessing a terminal and using commands such as Tail. However, as infrastructure has changed to cloud and container environments, it has become difficult to manually check logs one by one.
A service or solution (SW) that makes log monitoring easier can help you collect distributed logs into one place and issue alerts when there are issues affecting system performance and health. They help you collect application, service, and system logs and detect health in real time so you can resolve issues before they impact your customer. As with all tools, just monitoring logs is not enough to determine root cause; the logs need to be analyzed by the engineers involved.
Log Analysis, How to Do It Effectively?
To go beyond collecting and monitoring logs to more effectively identify root causes, it's a good idea to analyze them in conjunction with application or server monitoring. By storing and consolidating data from software, services, applications, and all infrastructure that interacts with logs into one monitoring platform, you can quickly resolve issues, optimize application performance, and increase infrastructure availability. Ultimately, using a variety of monitoring services, including logs, is about quick troubleshooting, anticipating potential problems, and optimizing your systems, which is the foundation for your business to continue to grow.
What are the different log monitoring tools?
Log management tools are more efficient when they monitor logs, applications, and resource information together. For this reason, they are often bundled with monitoring or observability services.
1. ELK

The ELK stack is an acronym that stands for a stack of four open source projects: Elasticsearch, Logstash, Kibana, and Beat(file). Elasticsearch is a search and analytics engine. Logstash is a data ingestion tool that collects data from multiple sources simultaneously, transforms it, and stores it. Kibana is a tool that allows users to visualize data in Elasticsearch using charts and graphs. Filebeat is an agent that delivers different kinds of logs from a server.
ELK stacks are available as both installations and services. You can install and manage your own using open source, or you can use opensearch, the ELK stack supported by AWS. When adding a grok pattern, you need to connect to the server directly to set the filter, and you need to restart the logstash service every time you make a modification. Kibana provides several default dashboards, and you can customize the provided dashboards. The built-in dashboards are sufficient for normal log monitoring, but they don't feel very user-friendly. If you need a custom dashboard for your monitoring, you can get sophisticated with DSL queries.
Key Features
- Quick and easy to get started with pre-configured dashboards
- Customizable with DSL queries
- Self-implementing and operational, ELK learning required
2. Sematext

Sematext provides monitoring and logging services. You can collect data from servers, applications, databases, containers, systems, and more. With Sematext, you can collect logs from multiple data sources in one place and view them in real time. Sematext Logs is a service built to work in the cloud with support for ELK (Elasticsearch, Logstash, and Kibana). By utilizing the ELK stack, you can collect logs and manage them in the cloud without the need for infrastructure management or costly consultant fees.
Key Features
- ELK Support
- Provides infrastructure and application performance monitoring with log management
- Quick and easy to get started with preconfigured dashboards and reports
3. Datadog
Datadog Log Management can collect, tag, and store metrics and events from over 500 technologies. Log, metric, and trace can be integrated into one view to analyze log data. Users can drag-and-drop to customize dashboards and detect abnormalities with machine learning.
Key Features
- Full-observability
- Unlimited log data types
- Cost varies by data collection option
4. WhaTap

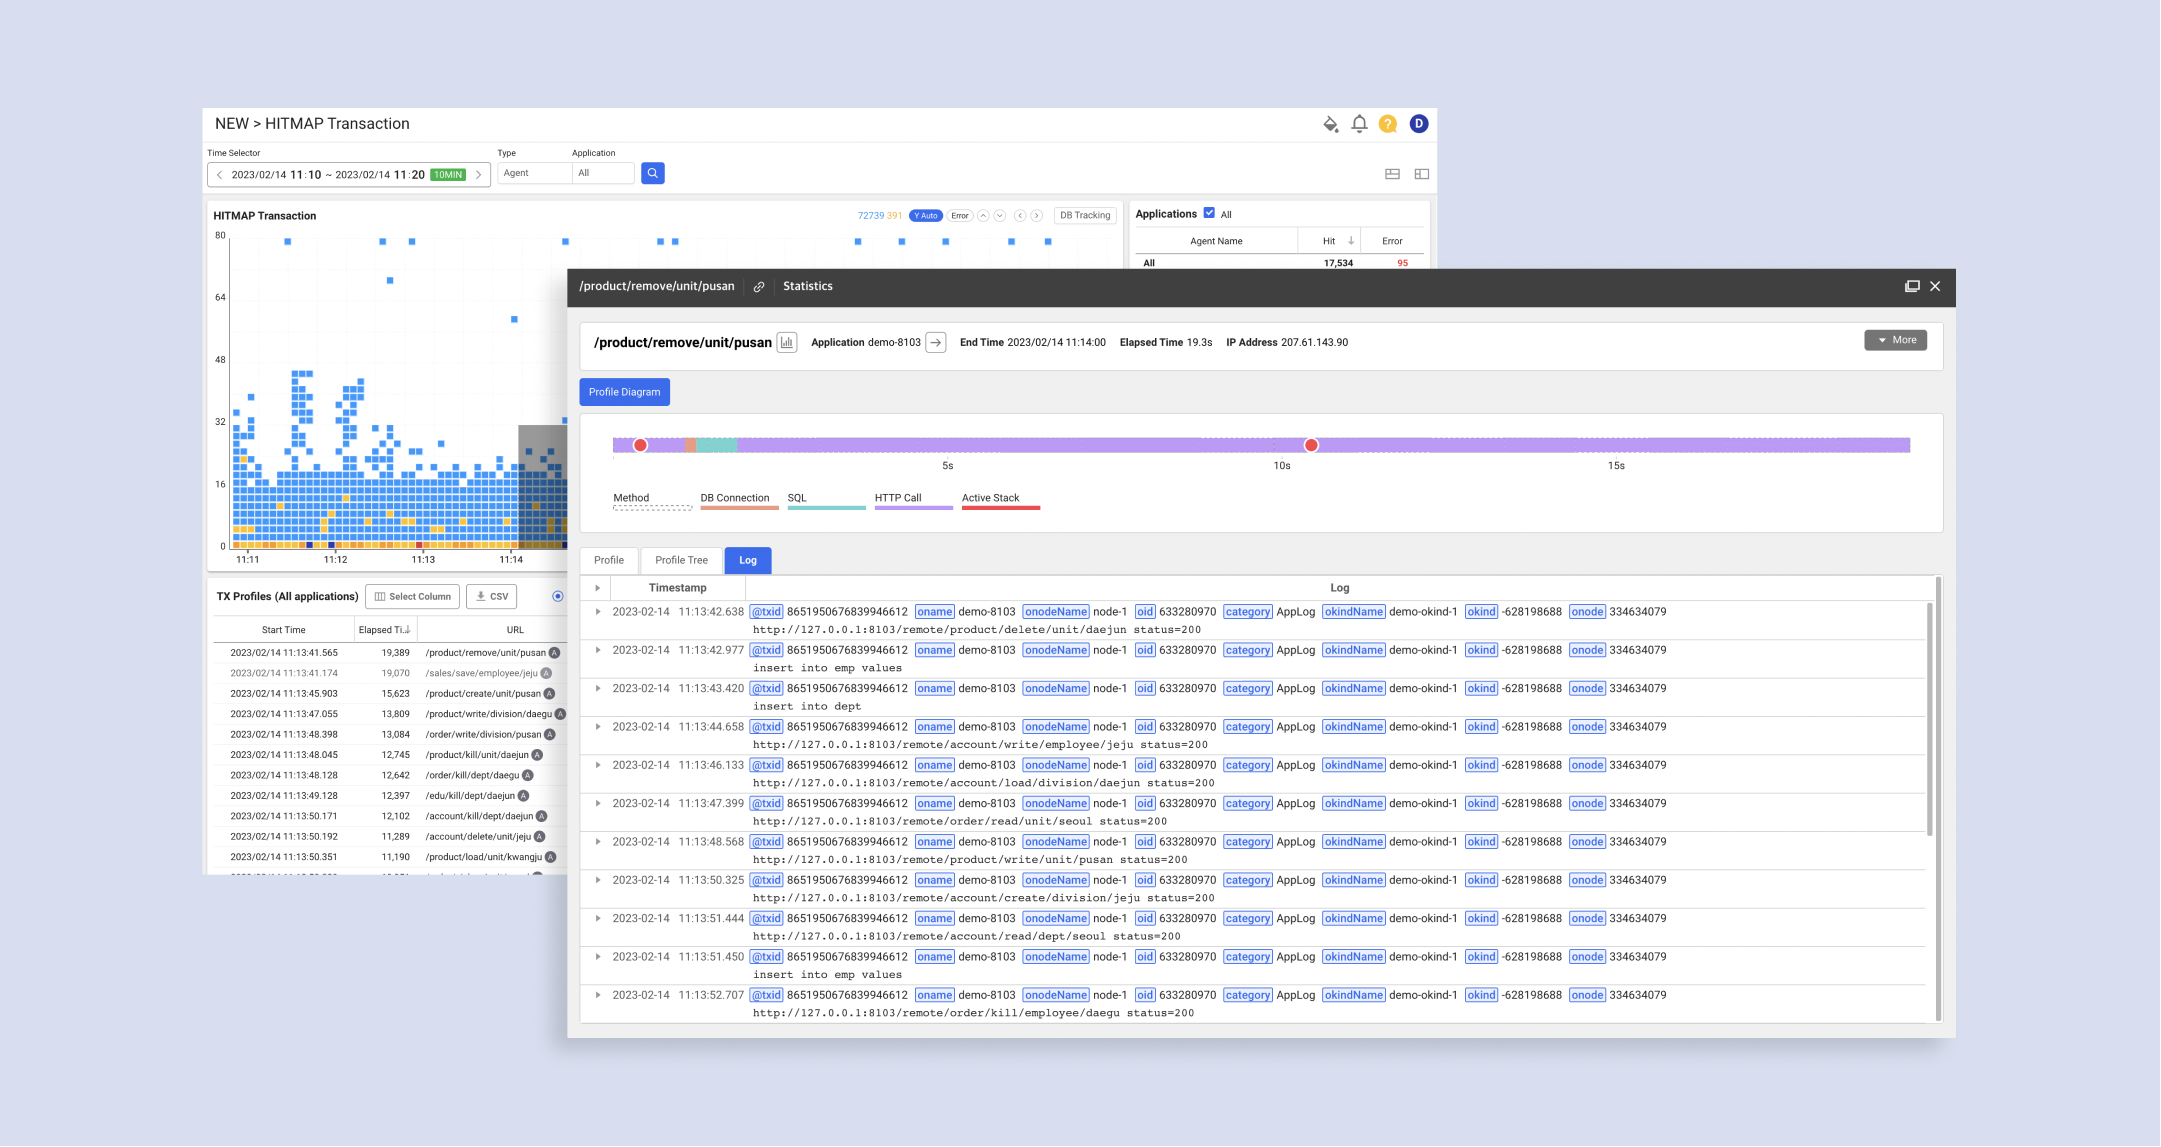
The last service we'll discuss is WhaTap. WhaTap provides multiple monitoring services including Server, Application, Database, Kubernetes, URL, Cloud, and Log. It is not a single monitoring solution, but an integrated monitoring platform, the same as a global service. WhaTap Log Monitoring is designed to be used in addition to WhaTap Server Monitoring or Application and Kubernetes Monitoring. The advantage is that data from monitoring services supported by WhaTap are stored on one platform, making it easy to perform correlated analysis.
For example, if you use application monitoring and logging together, we issue a unique transaction ID for each transaction when collecting transaction information, and because we collect the log at the same time, we already associate and store which transaction the log came from when we collect the data. This allows you to view related transaction traces and logs in a continuous line, making analysis easier.
In terms of service support other than features you can contact them via chat/email/phone in real time because it is a domestic company. In terms of price, it is cheaper than other monitoring services because it is calculated by the number of events without data storage costs. Foreign solutions sometimes charge more than you expect depending on the option to collect data other than the published price, but WhaTap charges the same amount as the published price.
Key Features
- Access log monitoring as an add-on to your existing WhaTap service
- Consolidate and search log from thousands of servers and containers
- Integrated monitoring of applications and log enables faster and more accurate cause tracking when issues occur
- Billed only by the number of events, low usage fee (less than 0.05 USD per 1 million lines)
- Live chat, email, and call support available
Conclusion
The volume of log collected in modern infrastructure environments is overwhelming compared to the past. Collecting and analyzing log is important, but if you can't make meaningful connections with the data you're collecting, the gains can be minimal compared to the cost of collecting logs. If you build individual tools for log analysis, tools for traces, and tools for metrics, meaningful connections to solve problems will be harder to find and your system will be more complex. We encourage you to integrate and manage logs, traces, and mertics in one monitoring platform to quickly find root causes and gain system observability.


