.svg)
.svg)


Java Process Memory Tracker
The WhaTap collector-server application is implemented in Java, with each module named for its role: Front for the UI, Yard for storing data, and Proxy for receiving data.
A few of the modules had incomprehensibly high memory usage, so we decided to start tracing them.
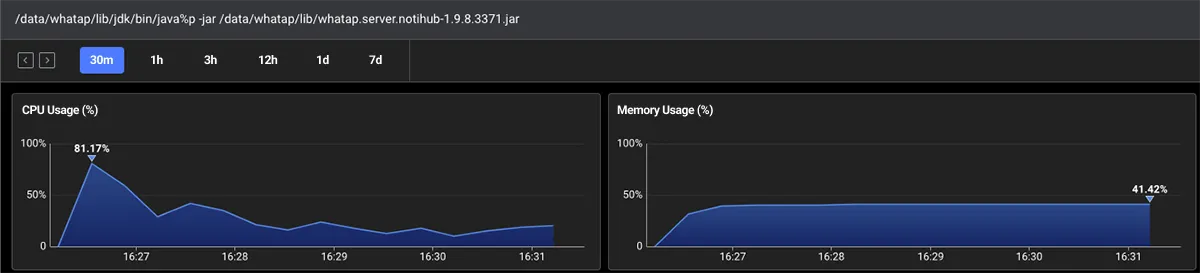
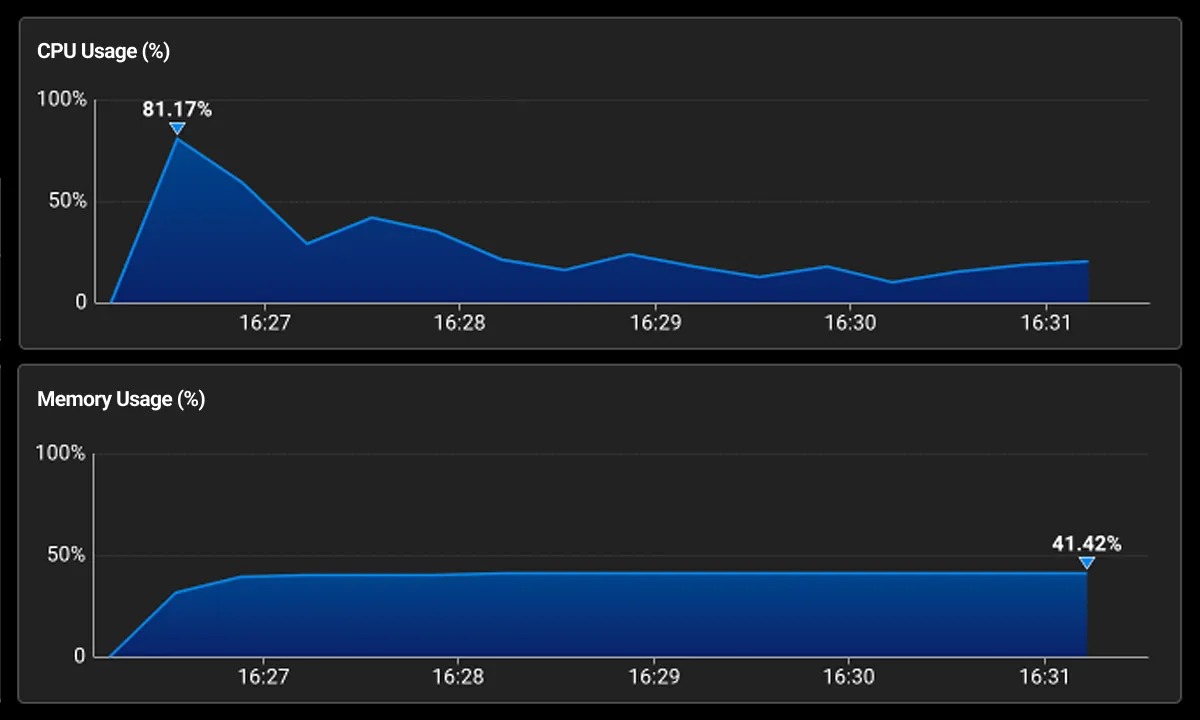
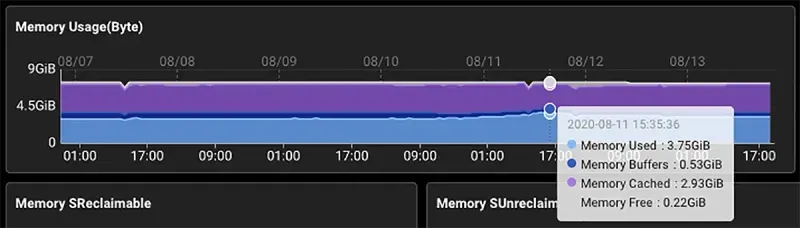
Memory usage spikes at application startup and does not decrease afterward.
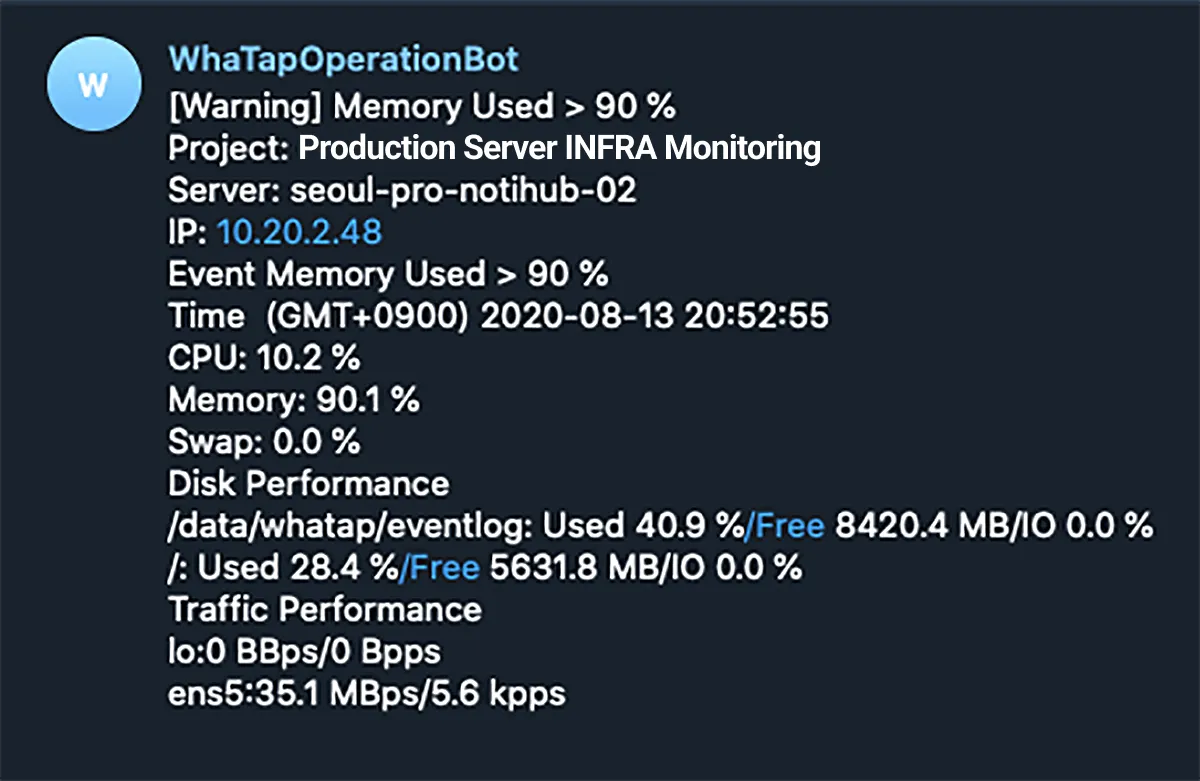
This intermittent alarm has been bothering me.
Why is Java process memory increasing?
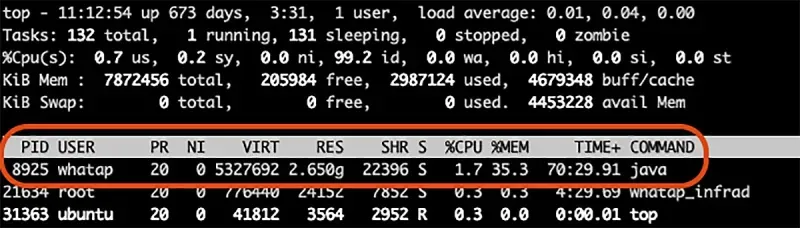
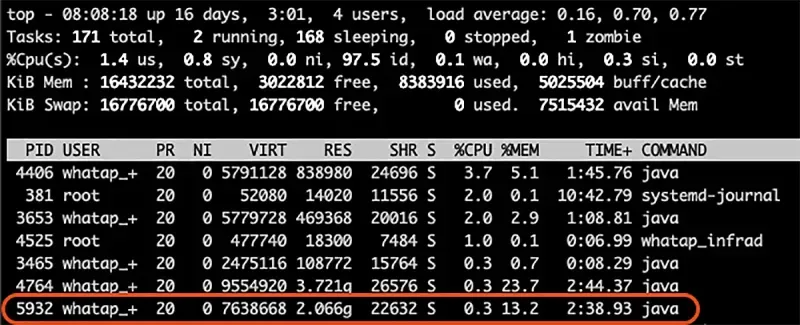
Why is the process memory 2.6Gb when the Java Heap size is 1Gb? There is an account module that manages customer account information among several modules in the WhaTap service. It does not do much and its CPU usage is low compared to other modules, but its memory usage is unusually high. There is also a module called Notihub that has similar symptoms. Notihub is responsible for notifying us of events that have occurred via SMS, Email, Slack, etc. This is an issue that we have been aware of for quite some time, but we have decided to track down the cause.
Java Heap = -Xms1g -Xmx1g
The Heap Size of the Springboot implementation of Account is set to 1Gb.
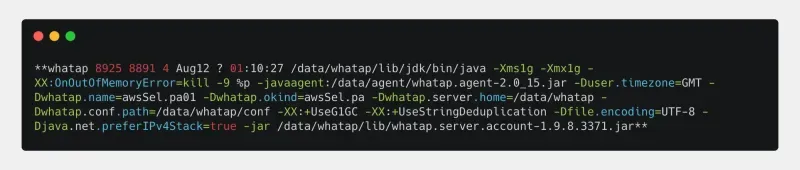
It uses a 1 Gb Heap, but the process memory usage is 2.65 Gb.
Heap usage patterns are no big deal.
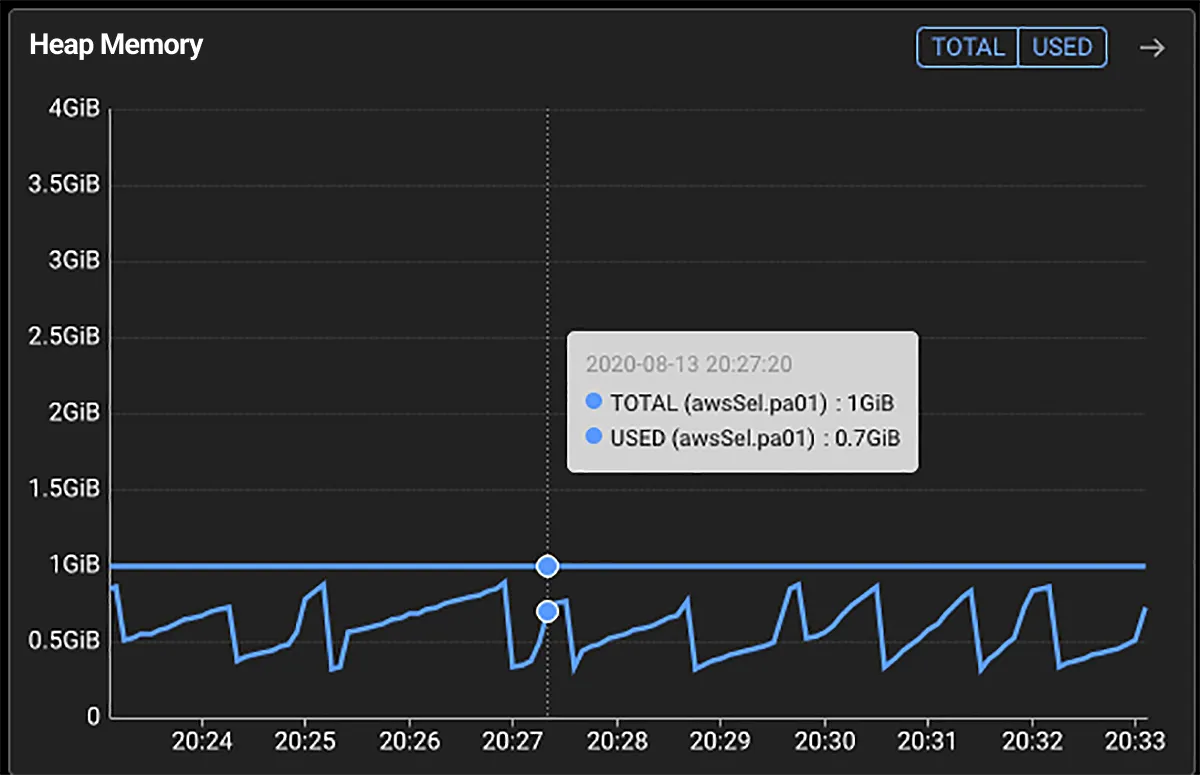
Heap 1G is overflowing with slack.
Why is my memory usage so high when my Account is just floating in vm....
What is going on with the Native area?
Out of the total memory usage of 2.65 Gb, 1.65 Gb is the Native memory area, excluding 1 Gb of Java Heap.
So, why is the account management module, which only serves authentication/authorization information without any complex processing during off-peak hours, using 1.5 times more memory than the Heap? For Heap issues, we can look at Java's Heap Dump, but how do we identify and track the Native area?
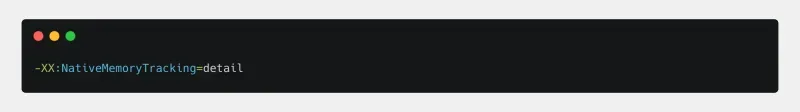
Step 1 - Native Memory Tracking
Native Memory tracking starts with applying options and looking at the data.
This process is described in detail in the Oracle Trouble Shoot guide.
Since we do not want to apply the above options to the production environment, we will try them in a test environment with the same symptoms. The difference with the production environment is the Heap Size and the symptoms are the same.
Environment2
Heap
Process Memory
Operations
-Xms1g -Xmx1g
2.65g
Test
-Xms512m -Xmx512m
2g
It is using over 2Gb!
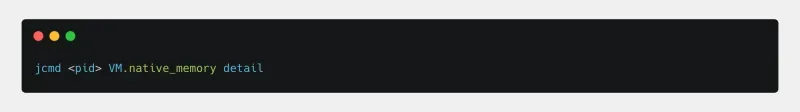
I tried to check using the jcmd command with the NativeMemoryTracking option applied.
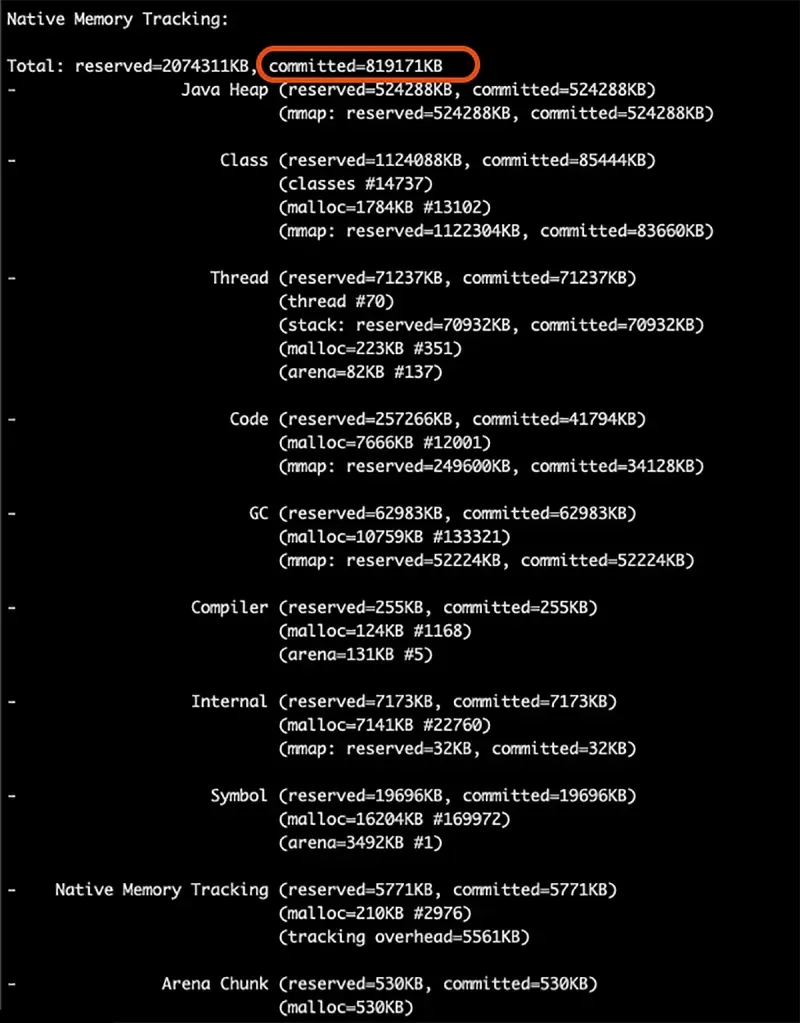
800Mb committed!
Reserved is the area of memory that could be available, committed is the area that is actually in use. I am pretty sure I saw 2Gb, but I know that java only uses about 800Mb of it, including the heap.
The remaining 1.2+ Gb of memory are stray friends that the jvm does not even know about.
Step 2 - Check from the OS perspective with pmap and smaps
The jcmd command shows 800Mb of usage. The JVM knows that it only uses 800Mb, so what should we track down the 1.2Gb that got lost?
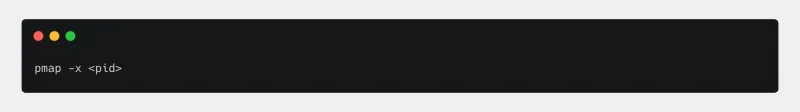
The JVM does not know, so we need to look at the process memory information from the OS point of view. The pmap command allows you to see the memory map of a process. https://www.howtoforge.com/linux-pmap-command/
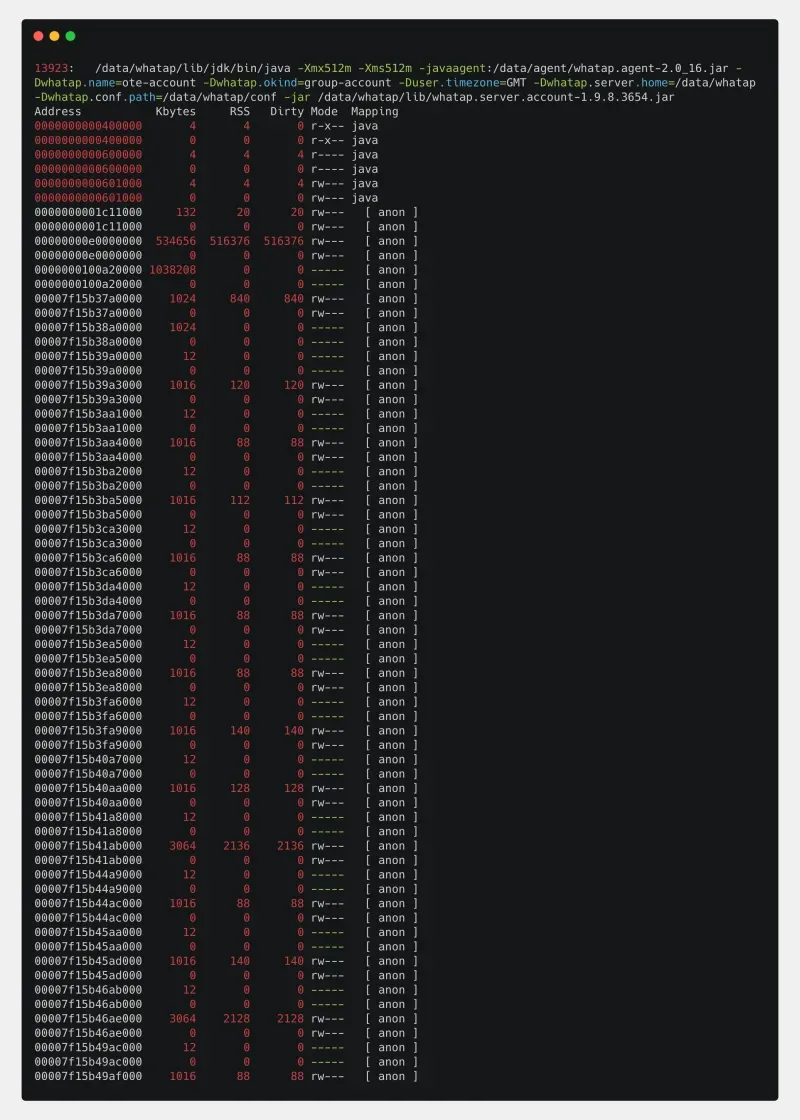
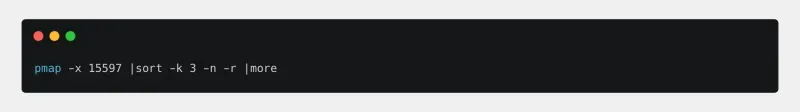
It is hard to see, I tried sorting by RSS to double check.
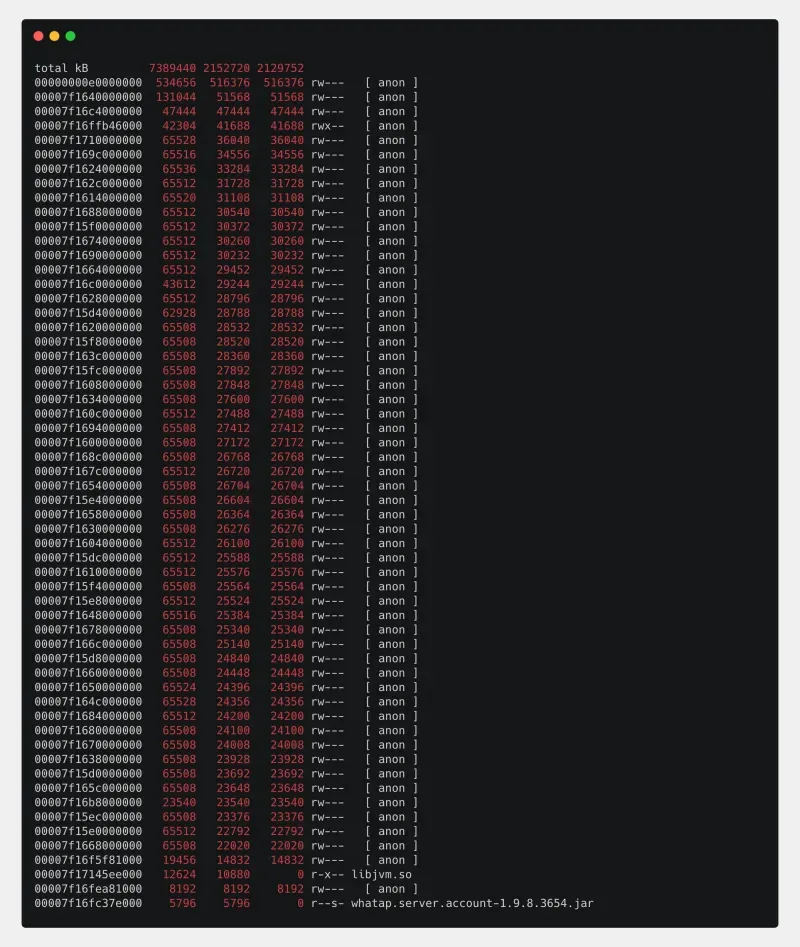
Total 2152720, it says we are writing more than 2Gb. The address 00000000e0000000 is the Java Heap set to 512Mb, the rest is the Native area divided into chunks of up to 64Mb. Let's check it address by address in /proc/<pid>/smaps.
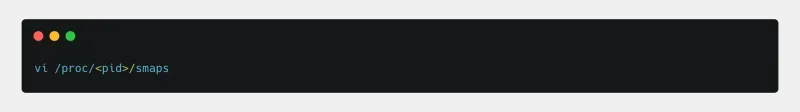
Obtain a range of memory addresses from the SMAP, which provides a little more detail than the PMAP results.
The PMAP address minus the four leading zeros is the same as the starting address in SMAPS. Check the PSS as an indicator of the memory occupied by the process. Exclude Heap, which has a starting address of 00000000e0000000.
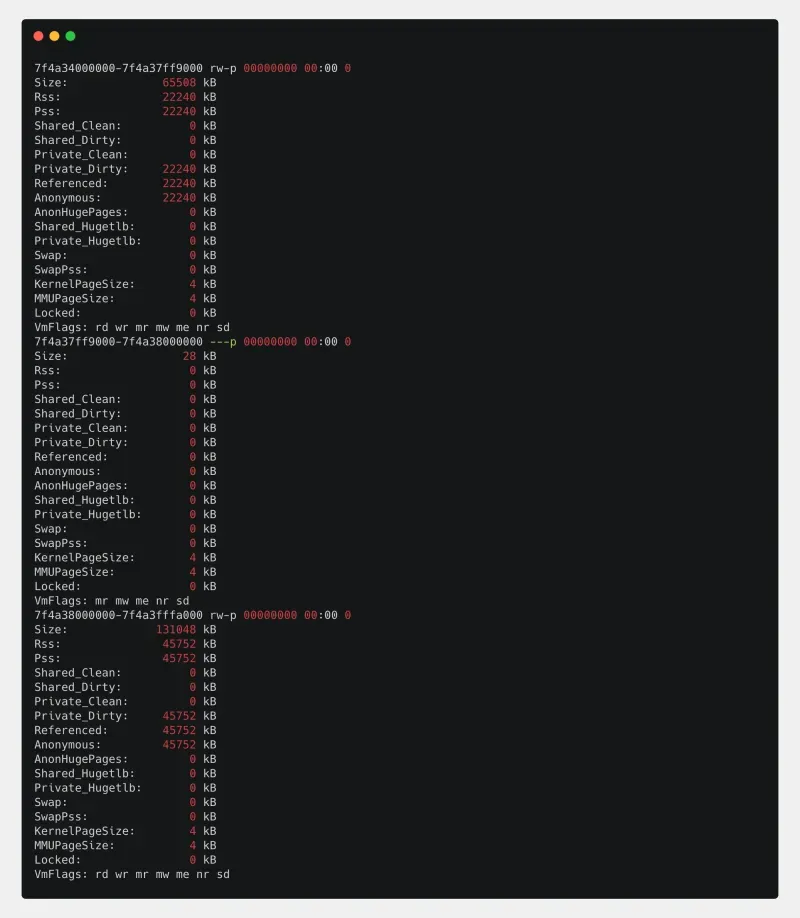
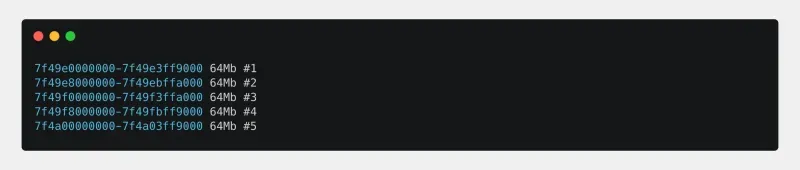
To see the actual history, get a bunch of memory addresses with high pss values divided into 64Mb sizes.
Step 3 - Dump the memory with gdb
To see what's in memory, we'll get a memory dump with gdb. https://www.gnu.org/software/gdb/
I got about 5 memory addresses in 64Mb increments from the pmap results in step 2 and wrote them down in a notepad.
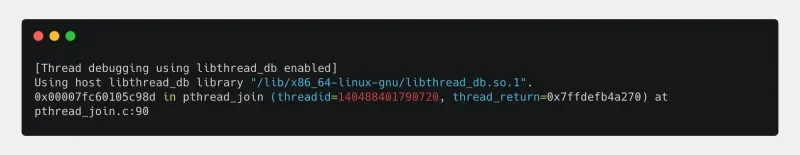
attach using gdb.

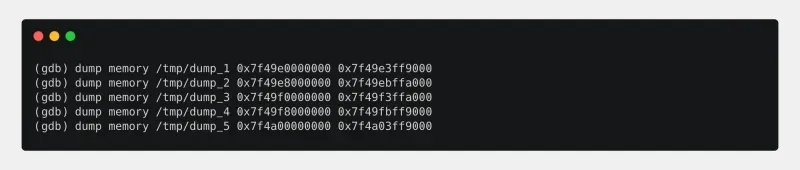
Dump to the address you obtained. This is a hexadecimal number, so prefix it with 0x.
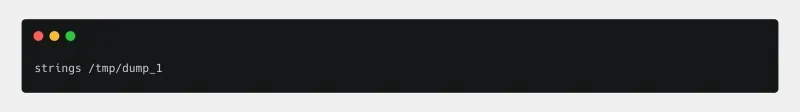
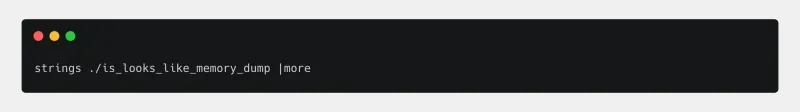
There are no special tools for analyzing the GDP memory dump we obtained, so we extract strings from the dump with the strings command and check them by eye: https://www.howtoforge.com/linux-strings-command/
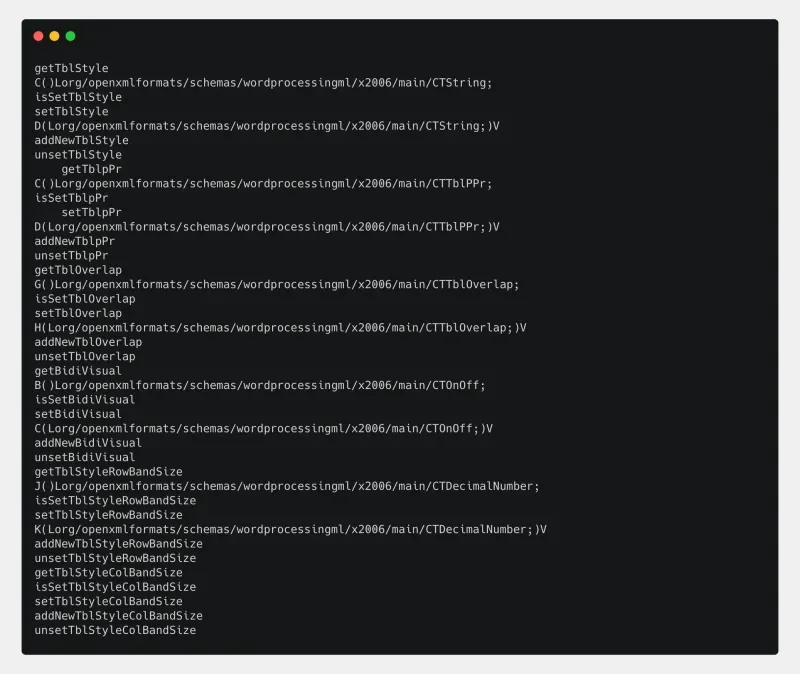
I also see this.
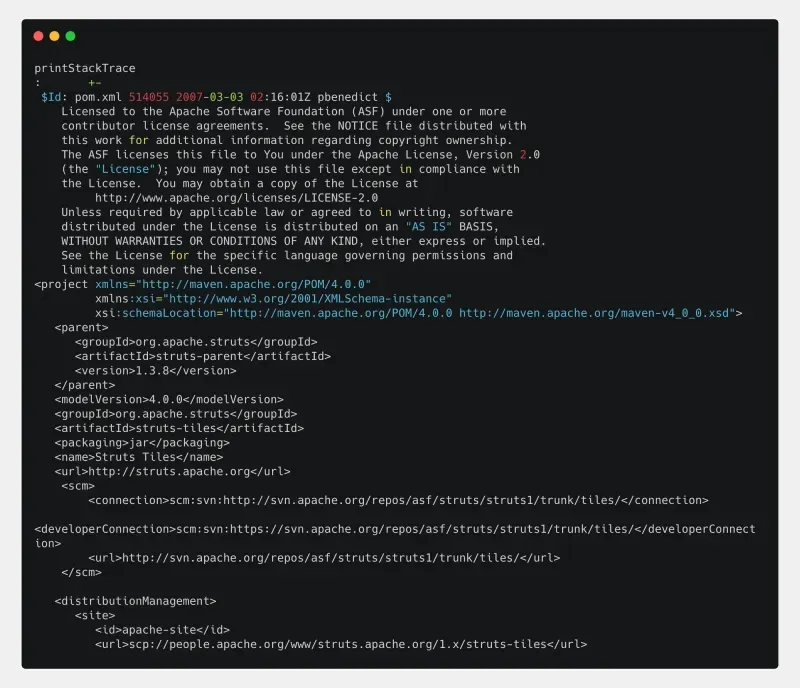
I also see things like this.
This is very strange. I checked the memory information for the sections that the JVM apparently missed, and they are all Java Classes, pom.xml stuff.
Step 4 - Infer and validate
Based on the memory dump, we made a hypothesis.
Hypothesis: This information is the contents of uncompressed jar modules.
To test our hypothesis, we picked a single jar file, unzipped it, summed them, and extracted the strings with strings.
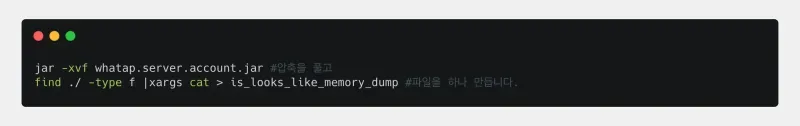
I checked it out.
They look the same!!!
After decompressing and merging the jars, the string extraction and the memory dump looked exactly the same, meaning that the decompressed jar contents were getting lost in memory, not the information used during the application execution.
Since the memory had increased at the start of the application, I tried checking the Stack information for the time of day when the jar might have been decompressed.
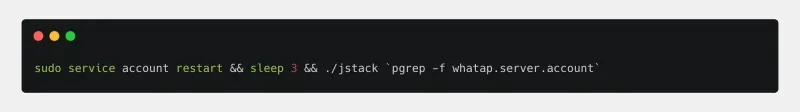
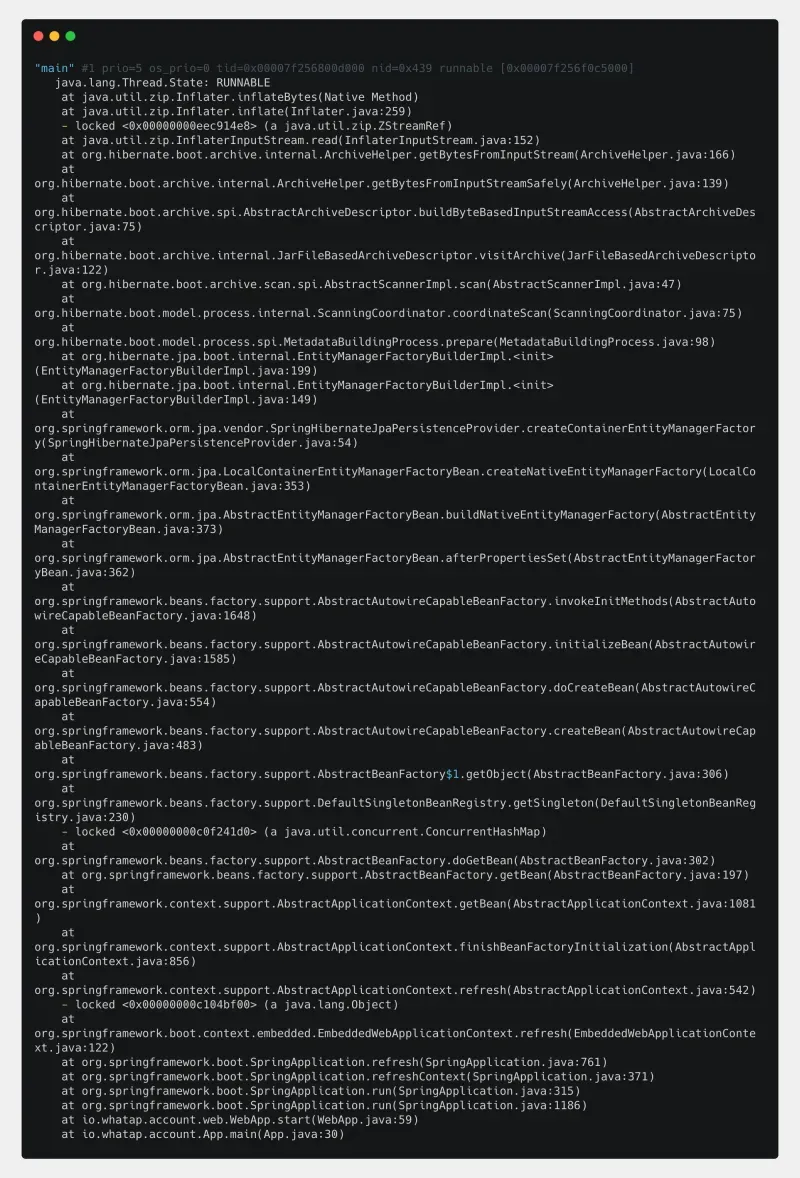
Bingo!!! "ZipInflaterInputStream" ole! "hibernate"
I said in the introduction that only a few modules show this behavior, but I see hibernate. It is a perfect fit. The modules that were causing problems with memory usage had in common that they were using hibernate.
I found a bug with InflaterInputStream that matches exactly what you are experiencing.
You can check it out here: https://github.com/spring-projects/spring-boot/pull/14001
Step 5 - Conclusion
Due to a bug in Springboot, ZipInflaterInputStream.close() was not releasing Native Memory and was unnecessarily occupying memory in Gb. To fix this, the core module org.springframework.boot.loader.JarFileEntries.class needs to be updated.
Java Native Memory Tracking
Many people find it difficult to look into the Native Memory area, even though it is not that complicated. Things that existed in the Heap area in the past have moved to the Native Memory area since Java8. So, recently, there is a need to keep looking into the Native Memory area, not just the Heap Dump. If you have basic knowledge, you don't need to be a developer to analyze Native Memory using smaps and gdb as shown above.
Result
For testing, we found that the memory usage was lowered from 2Gb to 800Mb (Heap 512Mb) when we started up after upgrading SpringBoot. We shared the analysis and bug with the person in charge of the development department. However, there are too many things to verify after upgrading SpringBoot, so we will proceed with the next major task.


