.svg)
.svg)


SDN Network Virtualization Failures
SDN Reference Links: https://www.juniper.net/kr/kr/solutions/sdn/what-is-sdn/
Phenomenon
During the system delivery deployment, we started receiving frequent cases of solution failures, which prompted us to analyze the cause.
On the surface, we were observing a large amount of logs due to the application's inability to communicate, and network disconnection of Tomcat/Mqtt/MariaDB/ElasticSearch/WhaTap Server Monitoring Agent.
Monitoring Situation
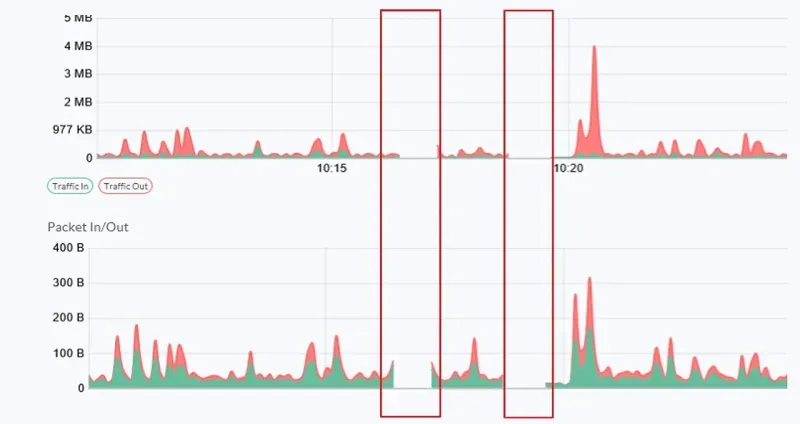
Server monitoring indicates that monitoring data is not being received, causing gaps in data.
Analysis
On the surface, you might suspect anomalous behavior of the server monitoring agent, but after checking the system, you observe that communication packets to the ICMP protocol are being lost, and you report this to the network virtualization operations team.
However, the network virtualization team responded that they were unable to detect any relevant signs.
Action.
As the issue remained unresolved, we consulted with the network virtualization team, reset the Ethernet on the virtualization servers, and changed the network virtualization band to a band where the systems were operating reliably.
With this, all customer systems were back up and running.
The takeaway
Monitoring should be able to objectively expose information about a situation without distorting it. Server monitoring agents are constrained by the fact that they are installed on top of the OS and cannot obtain infrastructure-level information that occurs outside of the OS. Despite this limitation, anomalies that occur simultaneously on multiple devices across the system can still show up in the monitoring of individual servers. In this case, from a monitoring perspective, the result is missing data.
This case demonstrates that missing data detection can also be used to detect infrastructure-level signs of failure.
Disk specification changes
Problem
We observed high resource utilization on the server that runs the development team's issue management tool within the organization.
Monitoring situation
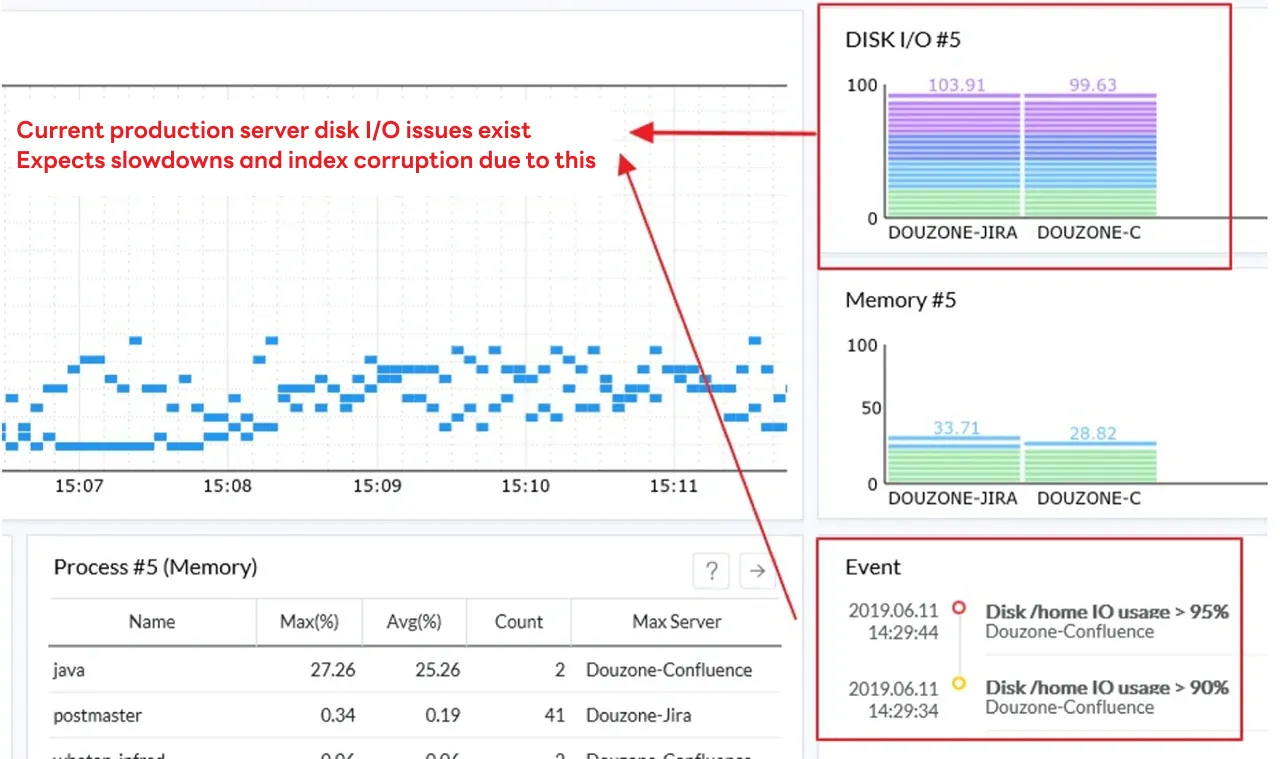
The Resources board in Server Monitoring was exposing machines with high Disk IO relative to availability.
Analysis
Based on the information that surfaced, we reviewed the history of failures that occurred on the same machine and found that the following anomalies occurred
- 3 slowdowns
- Index file corruption 5 times
- Disk full logs 1 time
Action
To resolve the disk IO issue, we considered introducing expensive equipment as the easiest alternative and considering HDDs to SSDs, and we also needed to consider the disk capacity. Considering the TCO, the plan to introduce expensive equipment was abandoned, and the plan to introduce SSDs but utilize NAS snapshot backups for the parts that were difficult to introduce in large capacity was decided.
Implications
The Resources board in Server Monitoring provides a summary of the current status of all your servers. The main chart for detecting the number and trend of servers with CPU issues, the Top 5 list for each major element of OS monitoring, exposing target resources that are more likely to experience issues, and the alert history of the server in order of most recent.
If you have a small number of resources to monitor, you will want a feature that makes it easy to understand server-level details, but if you need to monitor a large system, you will want a dashboard that provides a concise, issue-oriented view of key information.
This case can be seen as an example of leveraging WhaTap's resource board to detect major issues in the system in a hassle-free way.
Spec up to recommended specs
Phenomenon
We received a request for failure analysis and action due to user inaccessibility after the solution was deployed in the client’s environment. The client’s environment was deployed with servers that did not meet the recommended specifications when the solution was originally deployed.
Monitoring situation
Before taking action, we checked the disk monitoring details and observed that DISK IO was consistently at 100%, and a load situation due to disk read/write occurrences was observed.
모니터링 시간 = Monitoring Time
OBM 서비스 중지 요청 후 = After requesting to stop the OBM service
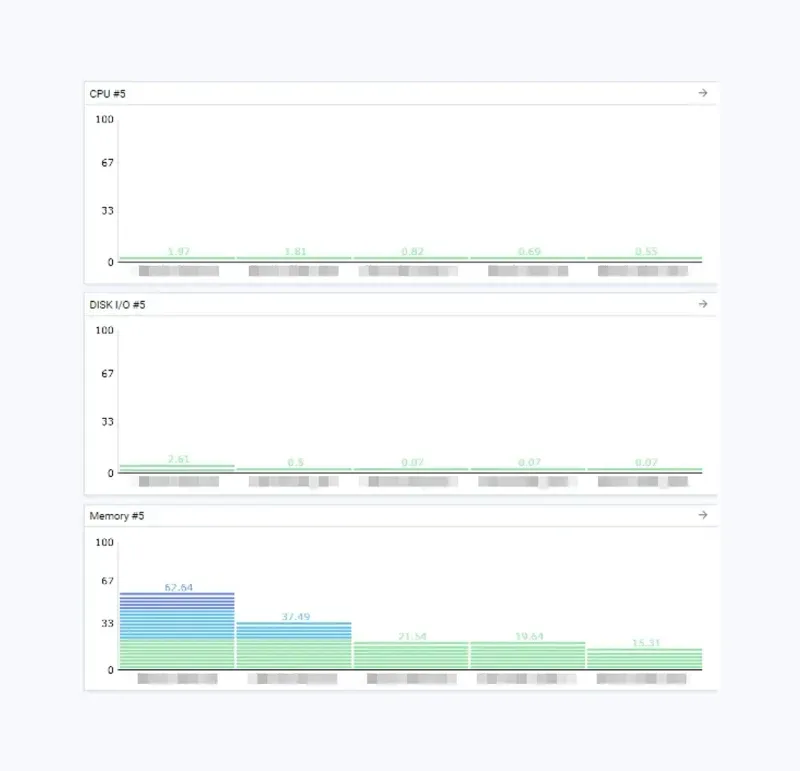
The resource board showed me the following CPU, Disk IO, and Memory utilization.
Analysis
By checking the difference in disk IO load between the situation when the on-site backup solution installed on this site was stopped and the situation when the backup solution was running, it was confirmed that the phenomenon was caused by the system being built with a server that did not meet the recommended specifications.
Measure
- If performing backups is causing disk IO and CPU overuse, you can also use the "ionice" command to adjust priorities. ionice reference link: https://linux.die.net/man/1/ionice
- Based on the recommended specifications, we replaced the SSDs in the server. As part of our pro active response, we also increased the CPU based on the recommended specifications, which resulted in significantly lower CPU utilization and Disk IO.
Implications
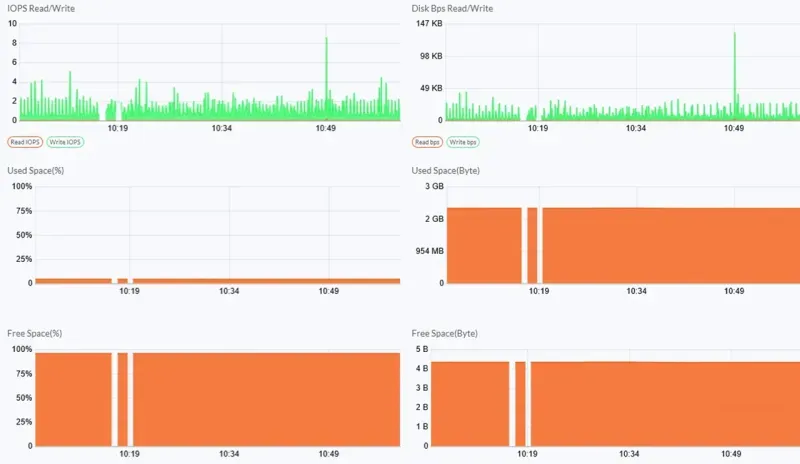
The Detailed View feature in Server Advanced Monitoring provides more detailed information by category: CPU, Memory, Disk, and Network. By viewing the long-term trends of detailed metrics in each category, you can make an objective decision on what actions to take next.
In this case, in addition to Disk I/O utilization, the trend of Disk Read/Write in terms of IOPS and Bps was used to identify the impact of the program executed at a specific point in time on the OS and to take action against it.
Acknowledgments
The above case was written by Mr. Homin Yoon, Deputy Director of The Zone Bizon, who provided us with materials that he utilized in the process of providing services to customers through WhaTap monitoring built in The Zone Bizon. We would like to thank Mr. Yoon for his valuable contribution.


