.svg)
.svg)


If your web application is performing poorly or failing, an application performance analytics service can help you troubleshoot many of the issues by giving you an inside look at the inner workings of your application. While WhaTap Labs is a company that develops application performance analysis services, we also analyze and troubleshoot application problems directly on behalf of our clients.
One of the application problems that many customers struggle with is JVM crash. Because JVM crashes are external to the JVM itself, there is limited information available from application performance analytics services, but you can troubleshoot them through a variety of avenues, including Google searches and IBM's site. Let's take a look at how to troubleshoot JVM crashes.
JVM Crash

The Java virtual machine (JVM) is the virtual machine in which Java programs run. Because it is a single VM, it is designed so that it cannot shut down without signaling from within. On the other hand, it can sometimes freeze for no apparent reason, like the blue screen of death you sometimes encounter on a PC. In JVMs, this is called a crash.
JVM crashes are infrequent and the cause is not attributable to the application that wrote it, making it difficult for developers to determine the cause. However, just like the blue screen of death on a PC, with error codes and memory addresses, JVMs leave clues before they die.
The JVM is an application, too.

Applications are equal in all bugs. Every application above a certain size has bugs, major or minor.
JVMs have bugs too, of course, and sometimes they crash. If the JVM crashes because of a problem in the application, that is also a problem with the JVM. A good JVM should be able to tell you about the error in the application with a friendly Exception or Error and not crash. If the JVM crashes for some unknown reason, it is a JVM bug.
Jump to the IBM JDK 8.0 Fix List
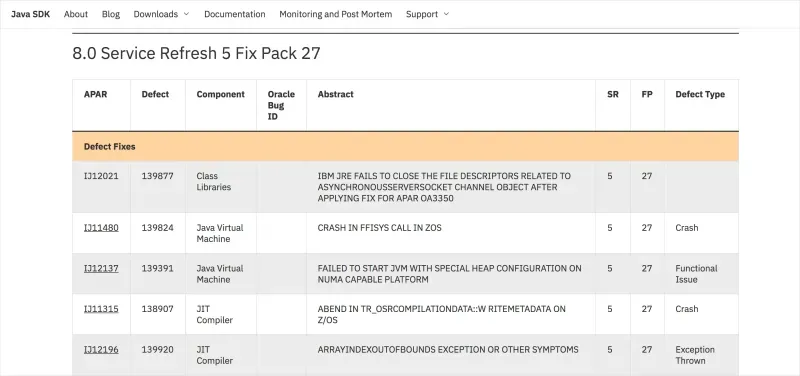
The good news is that the JDK bug fix list is easy to browse. IBM categorizes them by type: Crash, Hang, Performance, etc. Below is the 8.0 Fix Pack list. If you look at the Defect Type, you can see that it is categorized as Crash, Issue, Hang, etc.
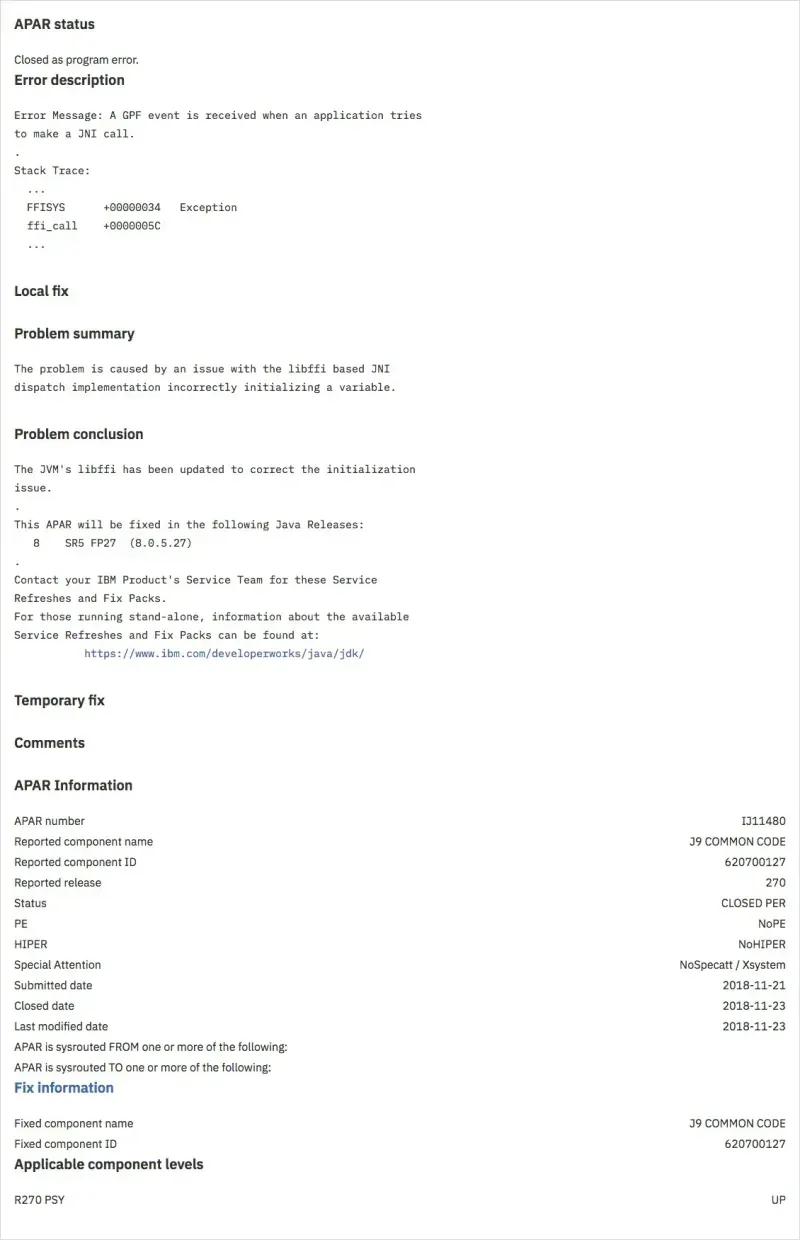
If you select IJ11480: CRASH IN FFISYS CALL IN ZOS from the bug fix list above, you can see the details of the bug as shown below.
Of course, Oracle also maintains a bug fix list.
Finding Error Logs Left by a JVM Before It Dies
The JVM is supposed to leave hs_err_pid (hotspot), javacore (IBM) when it exits abnormally. However, if the log is not created or cannot be found, you must apply the relevant environment variables, options, etc. to ensure that the log is left.
If you do not know where the log files are generated, specify where to write them as shown below.
For Oracle, use the product flag.
XX:ErrorFile=/var/log/java/hs_err_pid%p.log
Java Platform, Standard Edition Troubleshooting Guide > Location of Fatal Error Log
For IBM, use the .profile environment variable.
export IBM_JAVACOREDIR=/somewhere/dumpdir
Changing the location of javacore, heapdump and core file generated by TIP
If this still leaves no logs, you can suspect the following situations.
- /tmp usage full : If the /tmp filesystem is full, no logs will be written.
- Authorization problem : Logs are not written even if the account running the java process does not have write authorization to the target path. In this case, set the log path in the JVM options.
- JVM Bug : JVM Crash is also a bug, failure to record crash logs is also a JVM bug after all. It is very difficult to determine the cause.
How to view error logs
Below is the content of the Oracle hotspot hs_err_pid. At the top is the reason and where it occurred.
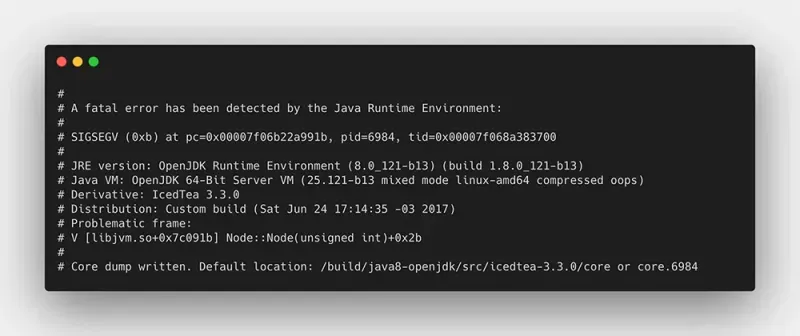
Here, SIGSEGV means Segmentation fault and is the reason for the crash.
Other typical reasons are Out of Memory Error caused by SIGQUIT OOME (OutOfMemoryError) caused by user's kill -3, StackOverFlow caused by StackOverFlow, etc.
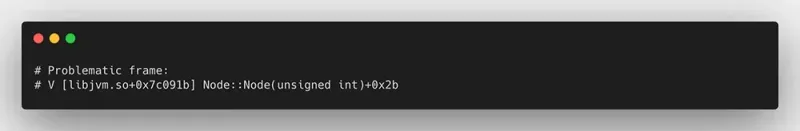
The Problematic frame indicates the location of the occurrence.
The example above is logged as occurring at location 0x7c091b in libjvm.so, so we know it is not an error in a user-implemented area.
Let's take a closer look at the same file.
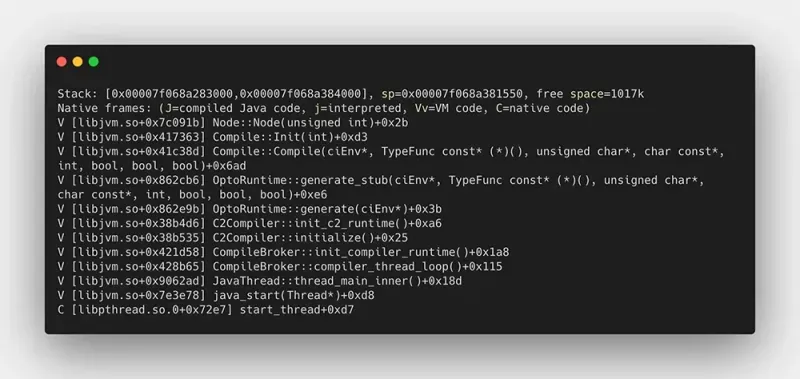
If you check the dump, you can see that 0x7c091b is the Node called by the Java Compiler. We can conclude that the crash was caused by a JVM error in the process of translating Java bytecode to machine language.
In the case of IBM Java, it leaves javacore. Like the Oracle hotspot, it has the reason and location of the occurrence at the top.
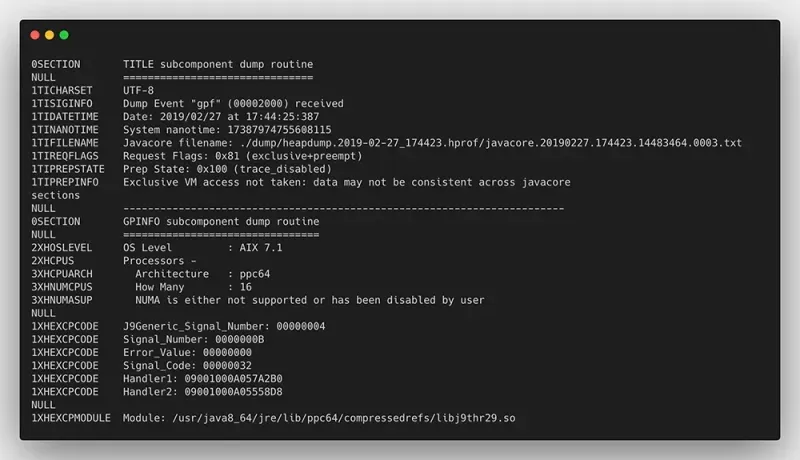
The reason for the occurrence, Dump Event "gpf", is a general protection fault and is the same as the Segmentation fault.
Again, the location of the occurrence is recorded below, Module: /usr/java8_64/jre/lib/ppc64/compressedrefs/libj9thr29.so.
Ask Google
If the cause of the crash is a segmentation fault (SIGSEGV) or general protection fault (gpf) and the location of the crash is in a JDK internal module, you can fix it with JDK Fix.
Once you have verified through the logs in Oracle Hotspot that the error occurred at line 0x7c091b in libjvm.so, now search for that line in Google.
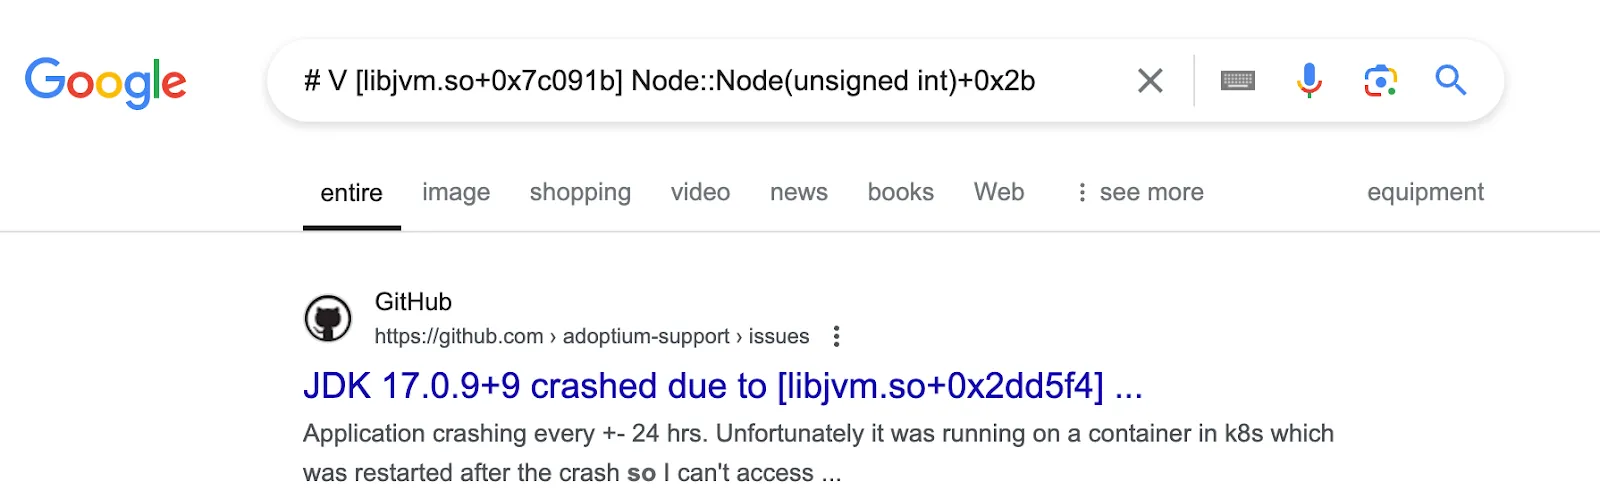
You can do a search to see the bug in that line. The status value is CLOSED. You can find the corresponding bug fix. https://bugs.openjdk.java.net/browse/JDK-8183197
Check the Comments at the bottom. You will find links to bug fixes.
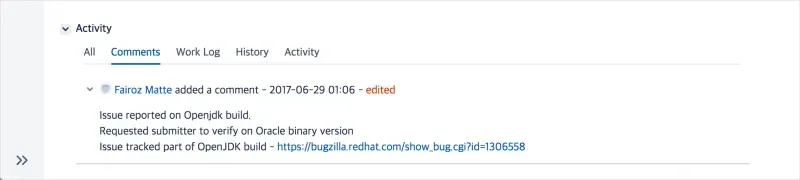
You can find more information in the link below.
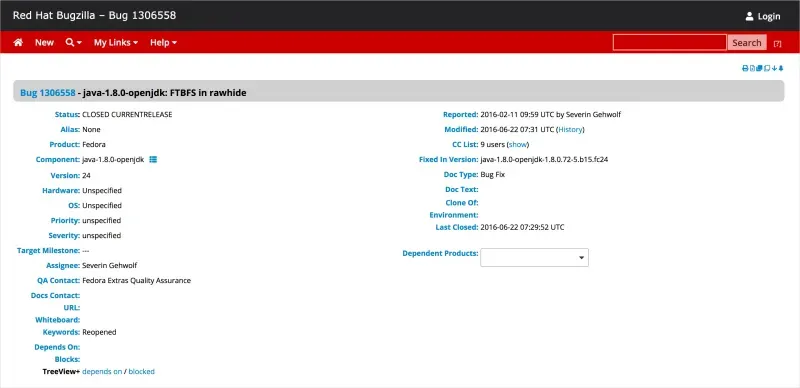
https://bugzilla.redhat.com/show_bug.cgi?id=1306558
You can now review the fix list for that JDK version and beyond and plan your updates. However, instead of planning updates, you might want to try to avoid the problem by changing the structure of your application based on the cause of the bug in question. In this case, an application performance analysis tool can help.
Wrapping up
The JDK is an application built by someone. Always recognize that the JDK is also subject to error, and regularly update it to make it more stable. And if you need to improve the performance of your application, or if you cannot solve an issue with your application, please contact us at support@whatap.io. We will do our best to help.


