.svg)


The meaning and purpose of load testing
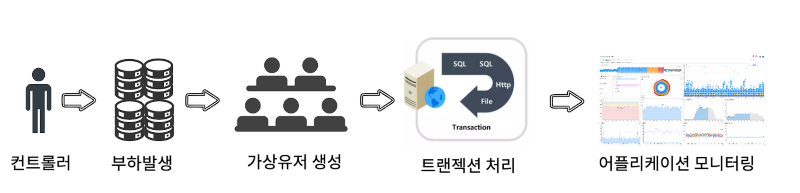
Load testing means testing a system by randomly increasing the load on the system. You can check how applications perform under normal and full load conditions, and breakpoints when they occur below full load conditions.
Load testing can determine the performance of components such as hardware, servers, and databases in advance. It also exposes application issues, including load balancing issues, bandwidth issues, and system capacity issues, so you can identify problems and manage anticipated future loads.
Load test method
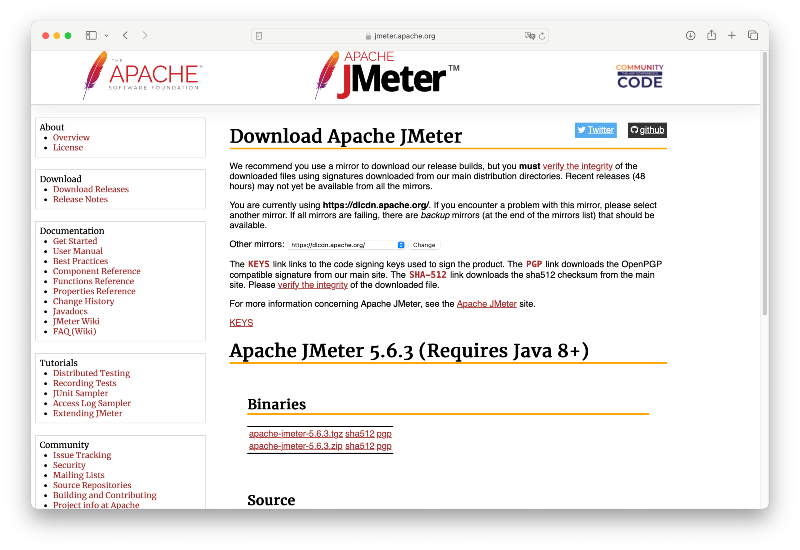
Load testing tool: Apache Jmeter
Apache JMeter was used as a load testing tool. Apache JMeter is an open source software mainly used to perform performance testing and load testing of web applications. JMeter is written in Java and supports a variety of protocols. This includes HTTP, HTTPS, SOAP, REST, FTP, JDBC, LDAP, and JMS.
Install and run Apache Jmeter
1. Download the appropriate program for your OS from the Apache Jmeter site.
2. Apache-jmeter-5.xx → Run the ApacheJMeter.jar file in the bin (*JAVA must be installed to run.)

3. How to test and basic use of Jmeter
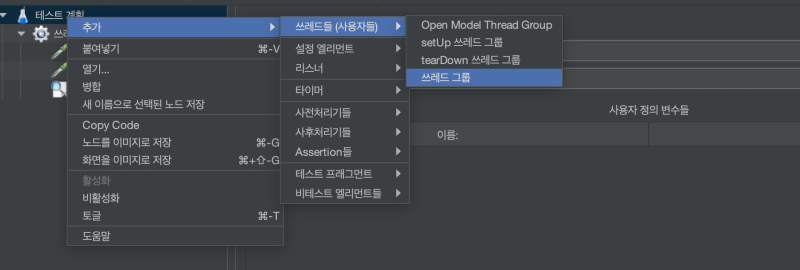
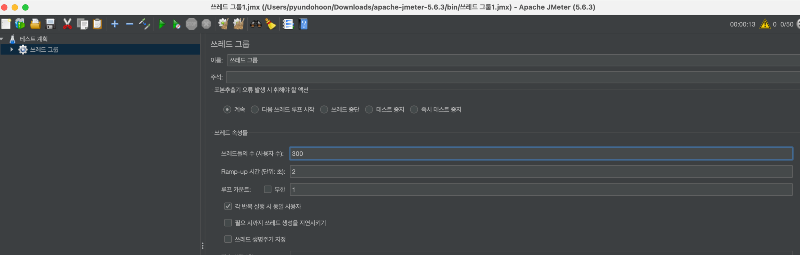
3-1. Creates a thread group.
- A thread group is one group that a test plan will perform.
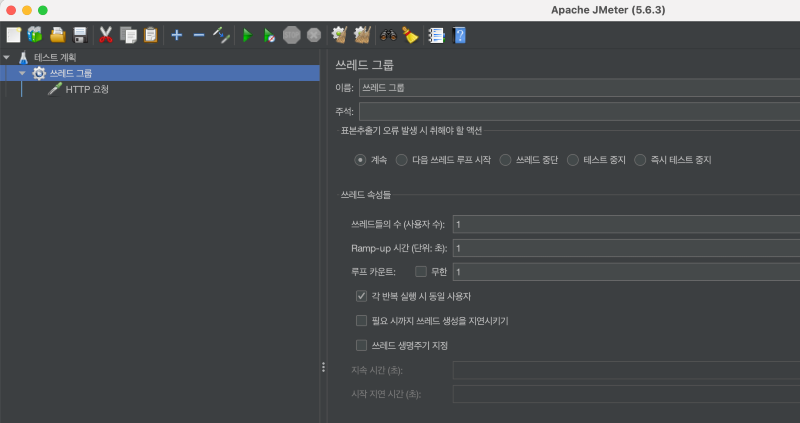
- Number of threads (number of users): Specify the number of threads that will be created in this thread group. (This means the number of users.)
- Ramp-up time (unit: seconds): Specify the amount of time to wait between the start of one thread and the start of the next thread.
- Loop count: Specify the number of iterations of a task belonging to the thread group.
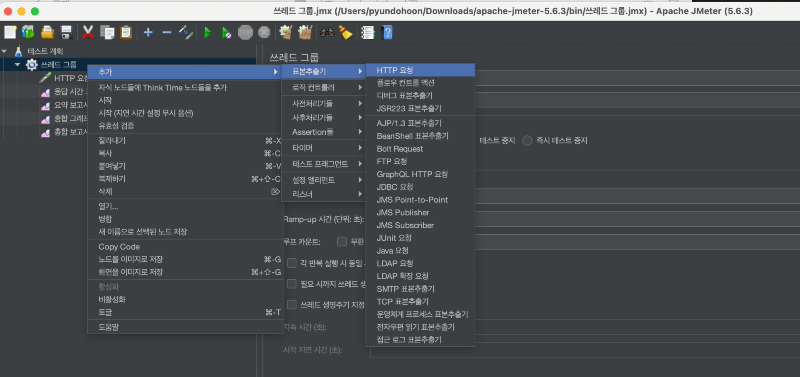
3-2. Adding HttpRequest
- The HttpRequest element sends an HTTP request to the server and receives the results.
- Thread Group - Add - Sampler - Select HTTP Request
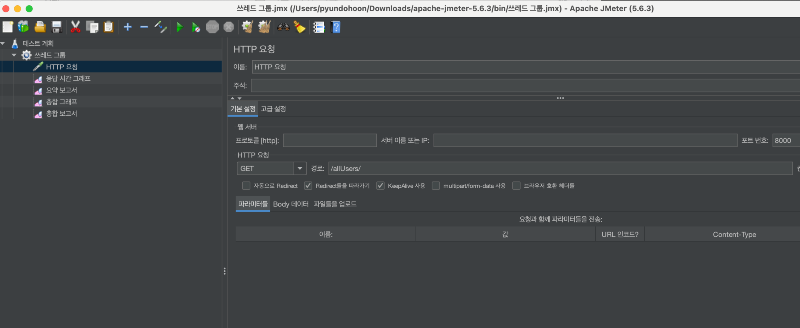
- Server name or IP: Type the name or IP address of the server.
- Port number: Enter the port number to be used when connecting.
- Protocol: Type the protocol you want to use. (mainly HTTP or HTTPS)
- HTTP Request - Path: Enter the name and path for the request.
3-3. Connect to a monitoring server that outputs test results
- Follow the agent installation guide to connect Whatap monitoring.
- Installation guide: https://service.whatap.io/v2/project/apm/38941/install
4. Run tests

Click the green play-shaped run icon in the Jmeter top menu to activate it.
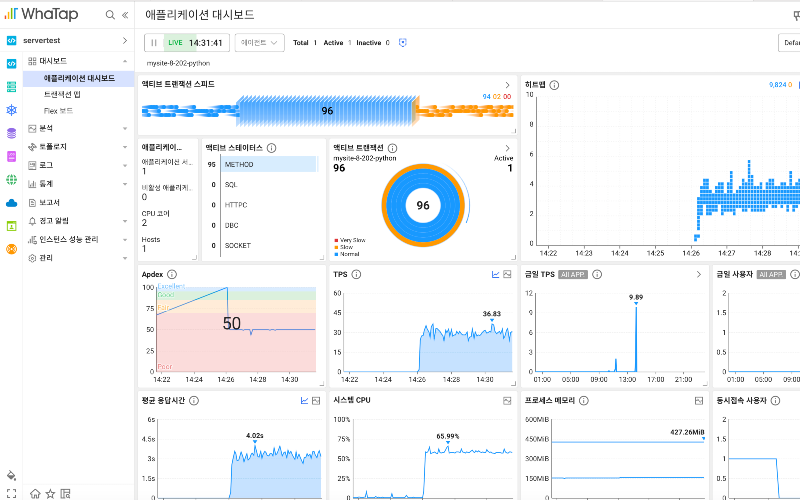
Execution results can be checked through the Whatap monitoring service.
Necessity of integration with APM
jMeter is a load testing tool, which allows you to test the performance of an application in various scenarios. However, it is difficult for JMeter itself to pinpoint the detailed performance issues occurring within the server. However, when used in conjunction with Watap Application Monitoring (APM), you can obtain additional information such as:
- Application internal metrics: CPU, memory usage, thread status, etc.
- Track transactions: Track how requests are handled within the application to identify bottlenecks
- Errors and exceptions: Errors and exceptions that occur during execution can be checked in real time
Provides real-time monitoring
You can use APM to monitor system performance in real time while applying load via jMeter. This provides the following benefits:
- Immediate feedback: Able to respond quickly when problems occur
- Real time adjustment: Test conditions or environments can be adjusted in real time during load testing to test more scenarios
In addition to this, the user-friendly WhaTap UI makes analysis easier.
Jmeter & WhATap analysis tool comparison
Examples of load testing scenarios:
First scenario
- Number of threads: 100 users who accessed the website
- Loop count: 1 number of times a user visits a website repeatedly
- Ramp-up period: 2 seconds to wait for another thread to start
Second scenario
- Number of threads: 200 users connected to the website
- Loop count: 1 number of times a user visits a website repeatedly
- Ramp-up period: 2 seconds to wait for another thread to start
The third scenario
- Number of threads: 300 users connected to the website
- Loop count: 1 number of times a user visits a website repeatedly
- Ramp-up period: 2 seconds to wait for another thread to start
Analysis with Jmeter
<1. View tree of results >
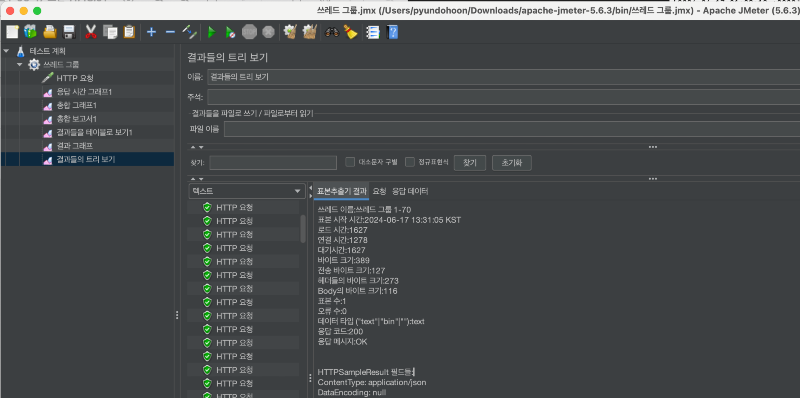
- Request: You can check the details of each request, request method (GET, POST, etc.), request URL, request headers, and request body.
- Response: You can view details of responses received from the server, response codes (200, 404, etc.), response messages, response headers, and response bodies.
- Additionally, you can check request and response times, and response data types.
Disadvantage: The result tree must be saved manually for each test, and detailed information about the request is difficult to obtain.
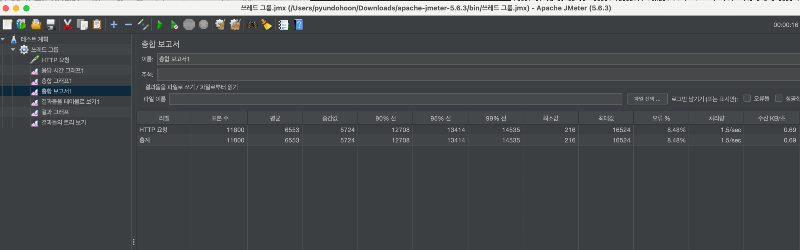
<2. Comprehensive Report>

100 threads
200 threads

300 threads
- Labels: the name or label for each sample
- Sample count: The total number of requests executed for each sample
- Information about sample response time
- It provides information such as error rate and throughput (TPS).
Disadvantage: Analysis results had to be stored separately for each test, making it difficult to see the trend of results based on the number of threads.
<3. Response time graph>
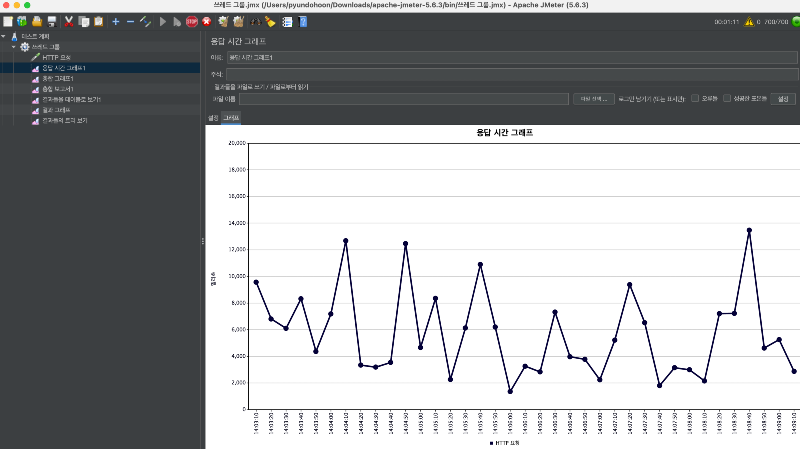
5-minute response time trend for 300 threads
Shows how response time changes over time during test runs.
Disadvantage: The response time graph can be output, but the x-axis, which is the section I wanted to check, could not be set, and accurate response time analysis was not possible.
Whatap analysis
<트레이스 분석>

Since APM can know the information that occurs inside the server, it can check not only what transactions have occurred, but also server data.
- Transaction details: request values, response data, user information
- API call analysis: API response time, call frequency, error rate
- Database query analysis: You can analyze the execution time and call frequency of queries.
- It also contains various information about application performance and issues.
<성능 추이 분석>
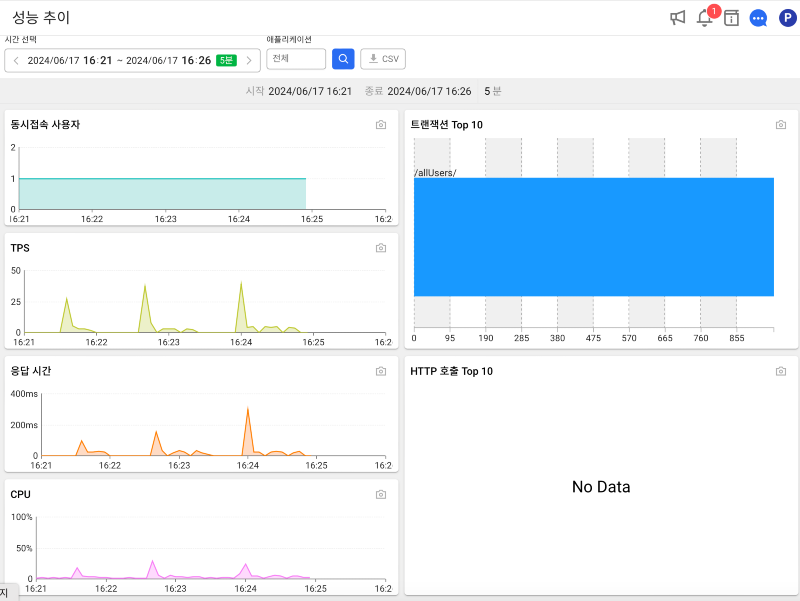
Through performance trend analysis, it is possible to analyze changes in performance and resource usage according to scenarios. This allows you to determine the resources required for the server.
<그외 히트맵 분석>


Horizontal line pattern
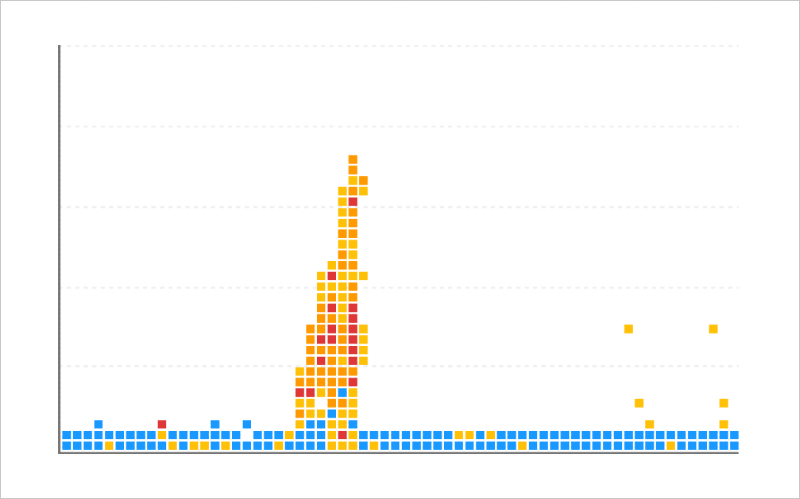
Overload pattern
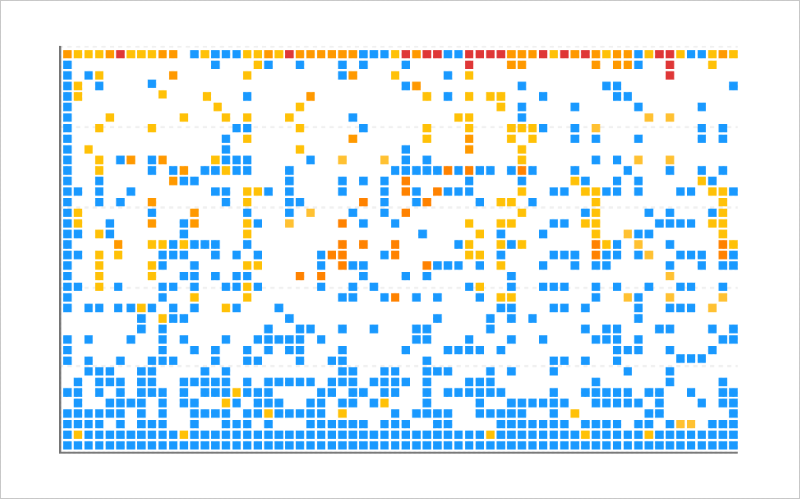
Runaway pattern
By analyzing specific patterns in transactions, you can analyze where the problem occurred. Additionally, key analysis points related to load testing include:
Transaction tracking and detailed analysis
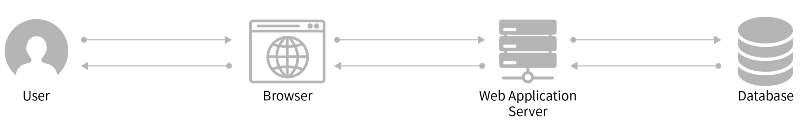
Analyze how requests are handled at each layer of the application by tracking transactions through Whatap. For example, it tracks the flow of requests leading to a web server -> application server -> database server.
- transaction flow: Visually check which path each request is processed within the application.
- Identify bottlenecks: Identify bottlenecks by identifying where requests are delayed.
- SQL query analysis: You can optimize slow queries by analyzing the performance of database queries.
Identify performance bottlenecks :Identify time-consuming segments through transaction tracking. For example, determine whether a particular database query is running slowly.
Performance changes as load increases: Evaluates the scalability of a system by analyzing how system performance changes as load increases.
For more information on how to analyze WhaTap, please refer to the following