.svg)

Hello, this is WhATap Labs!
Watap's network performance monitoring was conducted on February 2, 2024. 👏
In the past, network monitoring was operated in the form of monitoring and visualizing information dependent on servers and network devices through the SNMP protocol. Recently, the network market is growing in a larger framework of cloud and virtualization, and because of this, it is becoming increasingly likely to cause failure problems and factors using conventional monitoring methods. WATAP's network performance monitoring will solve this problem!
Today, let's take a look at why you should use network performance monitoring (NPM) and how to use it.
Network performance monitoring, why is it important?
In modern container-based virtualization environments, multiple containers run on a single appliance. Each container has an independent network stack, and communication between multiple containers exists even on a single device. Using traditional equipment-based network monitoring, it is reducing to prevent between containers and processes that have problems. In addition, it is changing from an on-premise (on-premise) environment where services are operated through existing servers and network equipment to an environment where services are operated in a virtual environment provided by a cloud service provider (CSP). In the case of the cloud, there is no physical entity, so the process of performing actual work is an important target for monitoring.
For this reason, traditional network performance monitoring methods have created gray zones that cannot be tracked due to cloud and virtualization. Since Watap's NPM tracks network behavior for processes, it can respond to changes in the cloud and virtualization environment.
Recently, the number of services based on micro service architecture (MSA) has begun, and network relationships are becoming increasingly flexible due to unique flexibility and flexibility. Tasks proposed to be useful services, such as high availability (HA) configurations and scale-out, are also complex networks. As relationships become more involved, the process of becoming more involved whether a load has been involved and the interval is becoming more and more involved.
Interventions, network monitoring must change from traditional device-centered monitoring to process-oriented monitoring. Whatap's NPM tracks the network actions taken by each process and visualizations complex components and state information so that they can be intuitively understood through topology.
What are the benefits of using network performance monitoring?
Watap NPM groups complex networks to quickly monitor performance metrics by segment. The topology dashboard allows you to quickly identify network faults through simplified and simplified network information.
- Reliable and detailed data collection
Wattap NPM uses eBPF technology to collect data. eBPF technology is a technology that exploits various events that affect in the kernel and adds additional operations in a sandbox environment. Since kernel events are intensive, detailed process level information is intensive, and stable operation is possible because it is sandbox-based.
- Gain visibility through tag options
Network monitoring products must provide diverse and complex network data to be sensitive. Watap NPM supports tag options so that network elements can be considered according to the user's goals and objectives. Various customizations can be made according to customer service requirements.
- Troubleshooting with raw data
Even without connecting to a server, the network status can be checked based on indicators at a specific point in time even after the fault situation has been resolved, and it supports underlying problems such as related servers and processes.
Also, since indicators are considered on a process-by-process basis, the following effects can be expected.
- Identify and improve service dependencies
Since metrics are measured on a process-by-process basis, service dependencies can be broken down into segments to check in detail. In addition to being able to check how services are dependent, it is also possible to identify specific where areas where efficiency is poor and makeup is poor.
- Network cost optimization
Due to the Nature of Cloud and MSA, which are recent trends, network costs are high. Since Watap NPM concentration metrics on a process-by-process basis, it is possible to reduce where unintended traffic loads are significant. Since an optimal network environment can be set up, network costs can be reduced.
- Adopting MTTD and MTTR for network failures MTTD (Mean Time To Detect, Time It Takes to Recognize a Failure) /MTTR (Mean Time To Repair, Time It Takes to Repair a Failure After Reacting a Failure)
Since traditional network monitoring was host-based, it is easy to identify which process or container is involved in a network situation that could not be specified. Since there is no need to connect to the server and check it one by one, recognition time and recovery time can be reduced in the event of a failure.
How do you use network performance monitoring?
Let's take a look at the network performance monitoring screen for yourself!
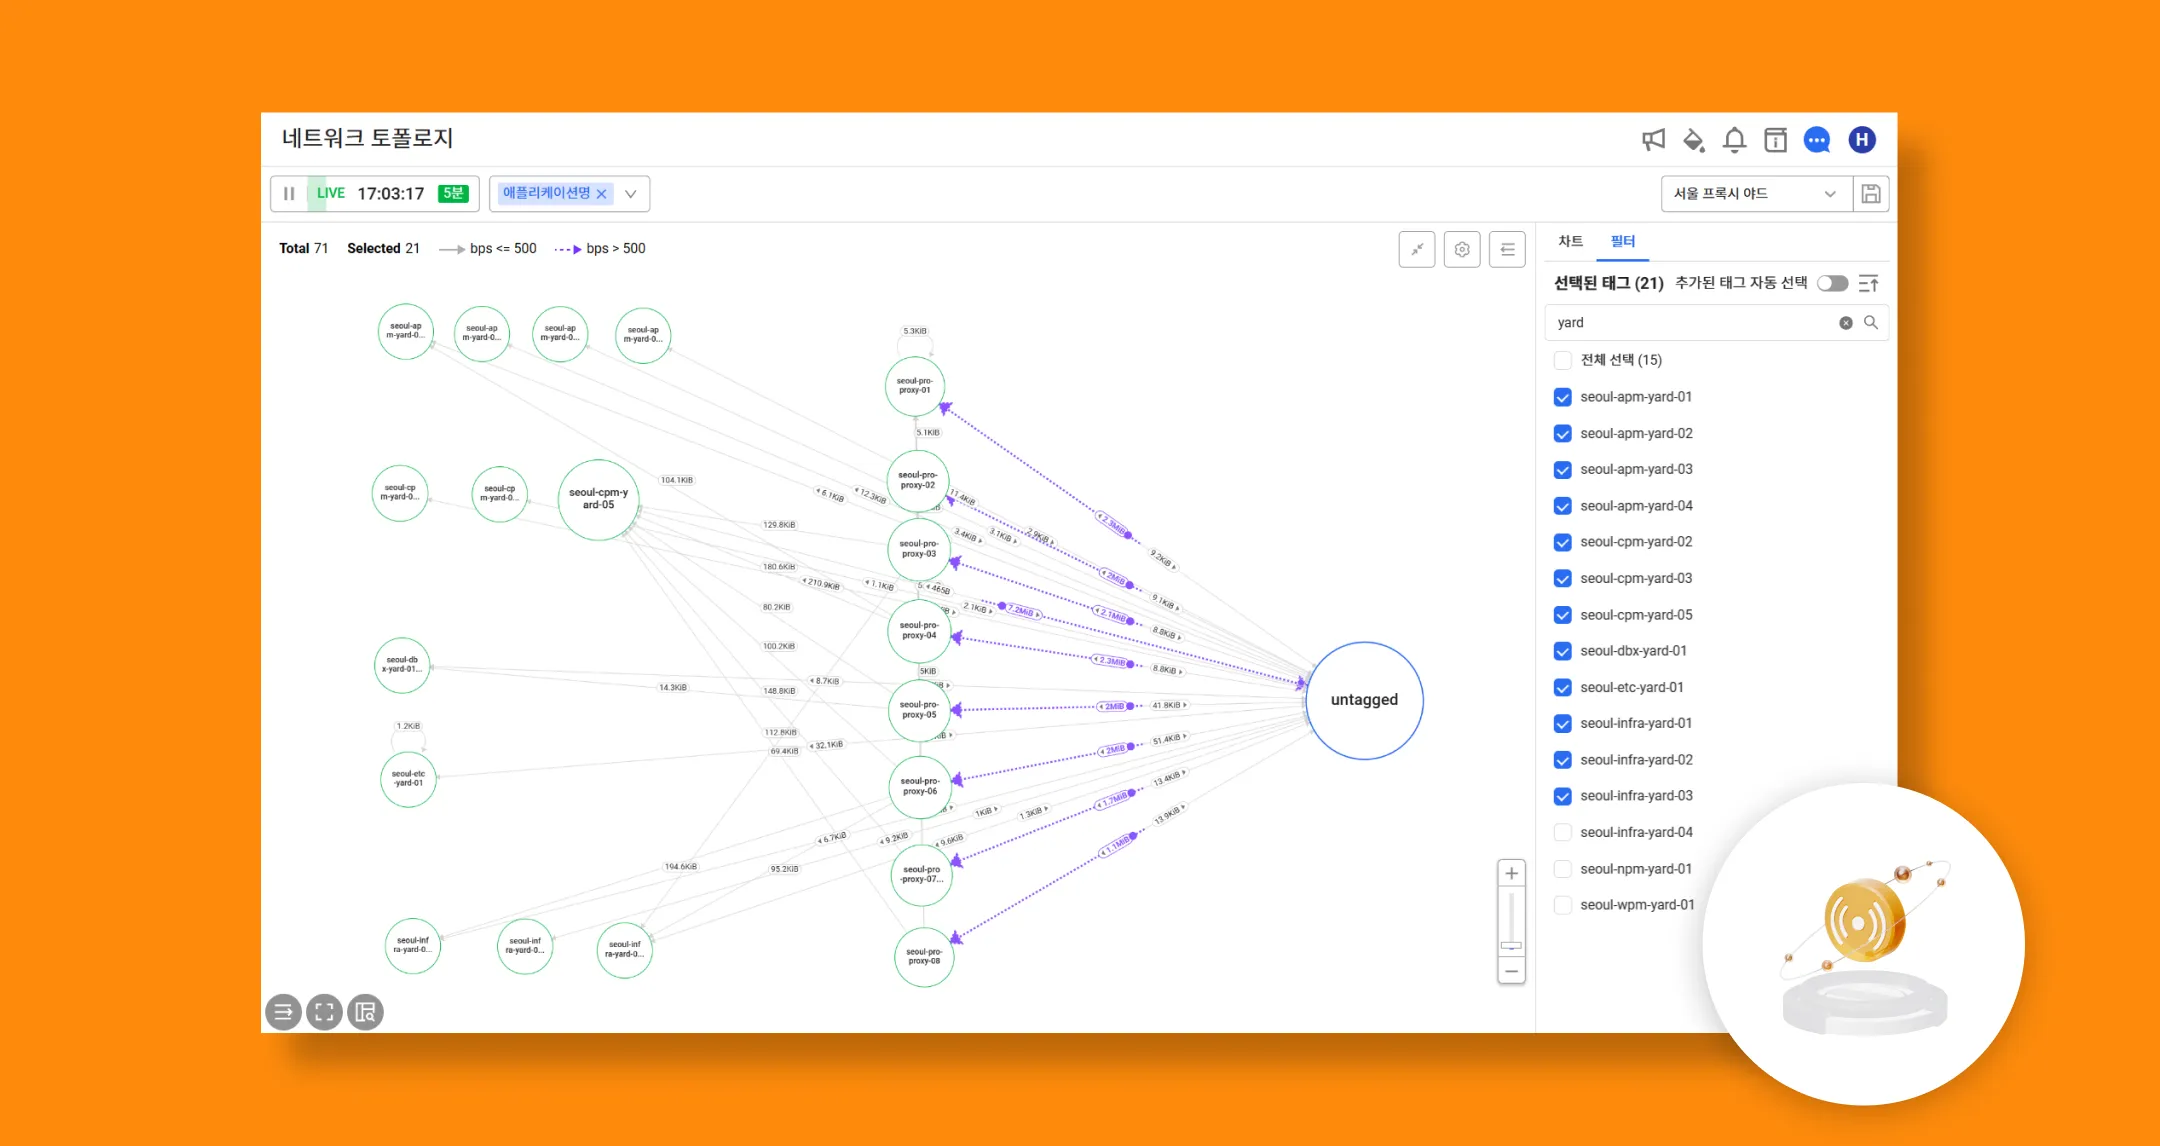
1. Network topology
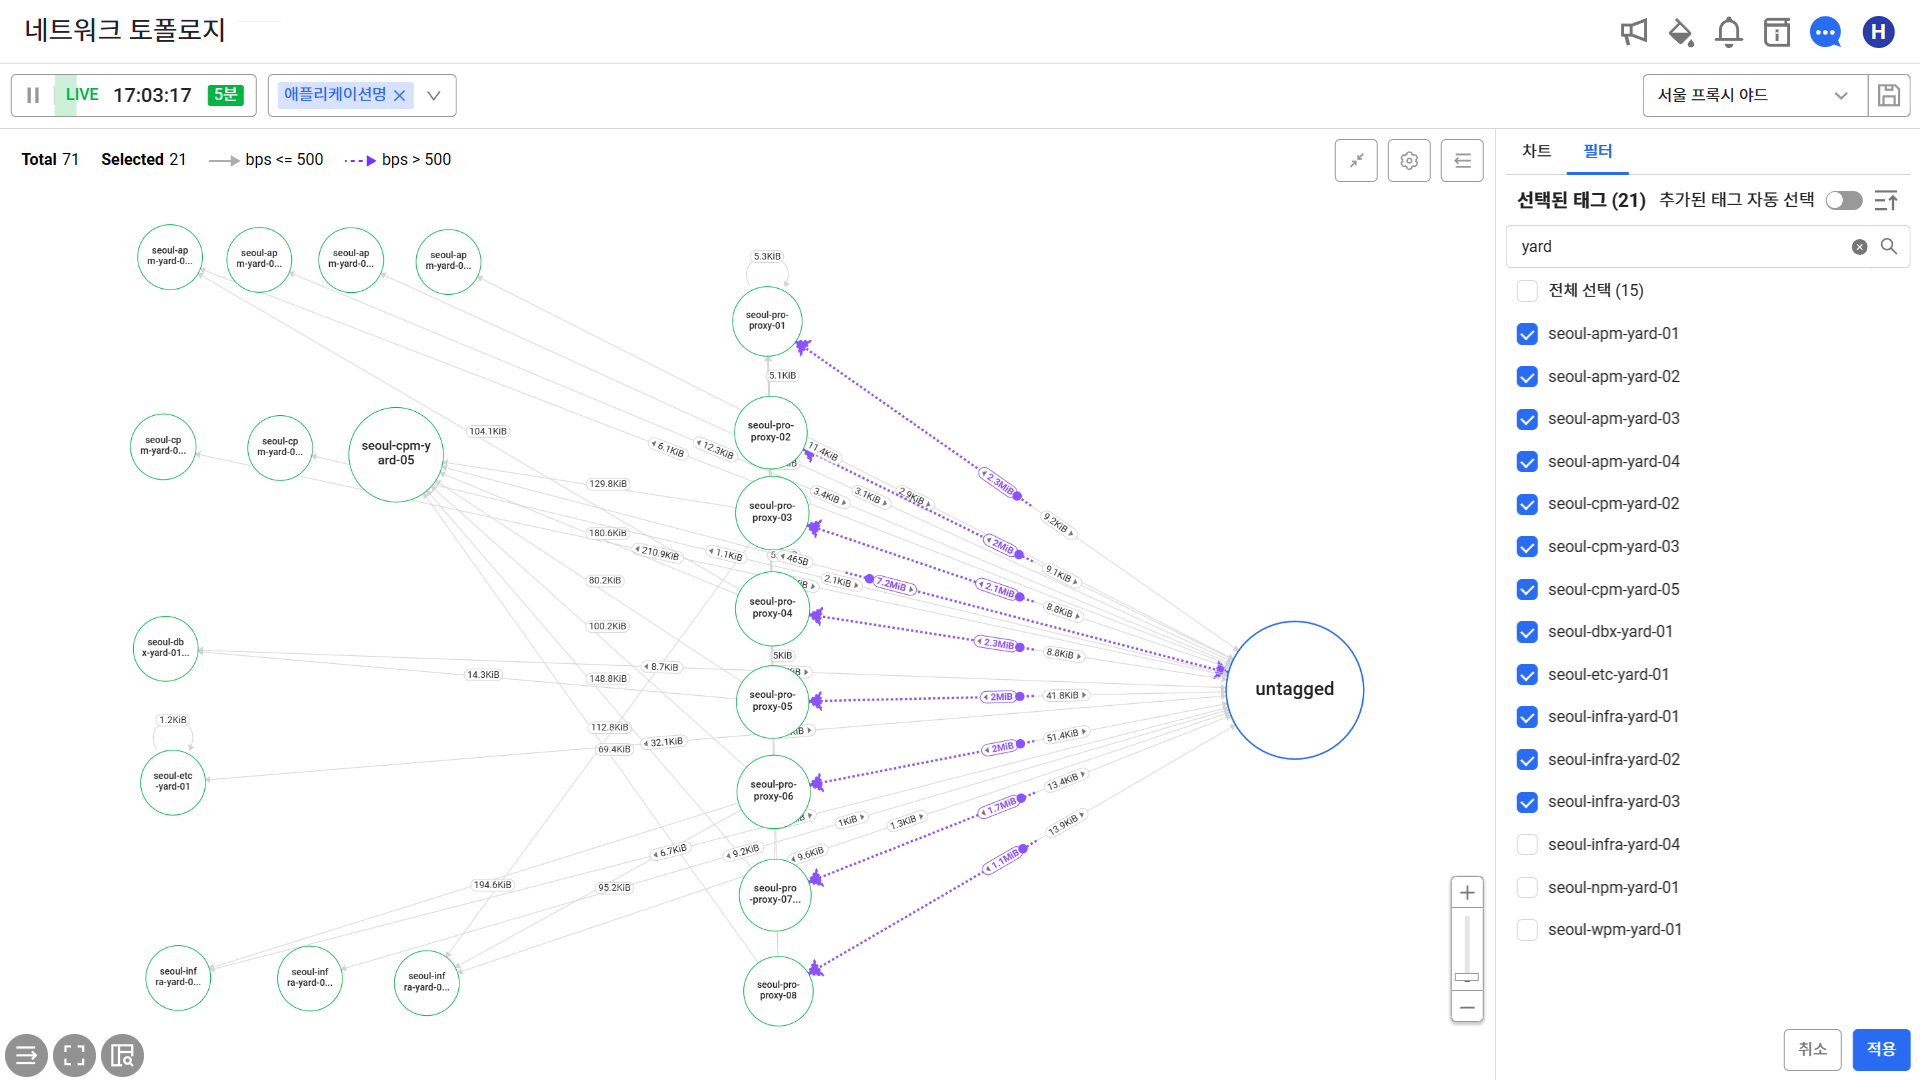
In the Network Topology menu, you can identify relationships between nodes at a glance through topology charts, and quickly check the Performance of Network Segments by Linking Them with Linear Charts for each indicator.
Topology NodesWith EdgeThis is a chart depicting a network. Combined with a time series chart for each performance indicator, network bottlenecks or fault zones can be more clearly identified. Real-time and historical data can be queried, and the performance of an abstracted network can be viewed by visualizing the performance of an abstracted network based on 'process type' or 'application' tags.
2. Network trends (TCP)

Network topology If the main purpose of the menu is to visualize network configuration information, Network trends (TCP) In the menu, you can check performance information displayed numerically in a dense manner on one screen. Performance information over time can be checked in real time, and performance information from a past point in time can be checked and used as data to analyze problems.
3. TCP session/UDP session

TCP session/UDP session Using session data presented through the agent as a menu, failure points can be identified in detail. It provides a filter function that can set multiple conditions to cause identify data. The identified data can be interpreted in csv file format so that it can be used as a separate resource.
How can I use each indicator?
1. Quality indicators
What is Wattap NPM LatencyWith Jitter It provides indicators. It can be used as a basis for performance issues and failures, and can be used in cases using TCP-based network communication.
- Latency: This is an indicator of network response time. Can high response times provide a poor experience for end users.
- Jitter: This is an indicator of variability in network response times. A high jitter value can be measured to mean that network differences and changes in the packet travel path considered in that section. Failure in a specific network segment can be considered, and the order of packet arrival is twisted, disrupted packet retransmission and leaks, leading to a failure in overall service quality.
2. Network usage metrics
It provides information on network usage and can be used to optimize cloud environments through unintended external traffic inflows (DDoS, etc.) and traffic patterns.
- bps: Bits per second (bps) is an indicator of the number of bits per second.
- pps: packets per second (pps) is an indicator of the number of packets sent per second.
- Session count: An indicator shows the number of unique sessions.
We discussed about Watap's new product network performance monitoring together. What did you think? If you create an NPM project now, you can use it for free for 15 days, so if you are willing, try it out!
Complex Networks, do you want to check them at a glance? Get started with Watap monitoring for 15 days for free