.svg)


Network Performance Monitoring Development Review: Connection Performance Analysis Using eBPF
Hello! As a project manager, I will look back on the experience and achievements of leading the Network Performance Monitoring project. While experiencing numerous challenges and collaborations over a total of 1 year through this project, let's take a look at how our group was able to solve technical problems and successfully launch products.
Introduction of eBPF technology
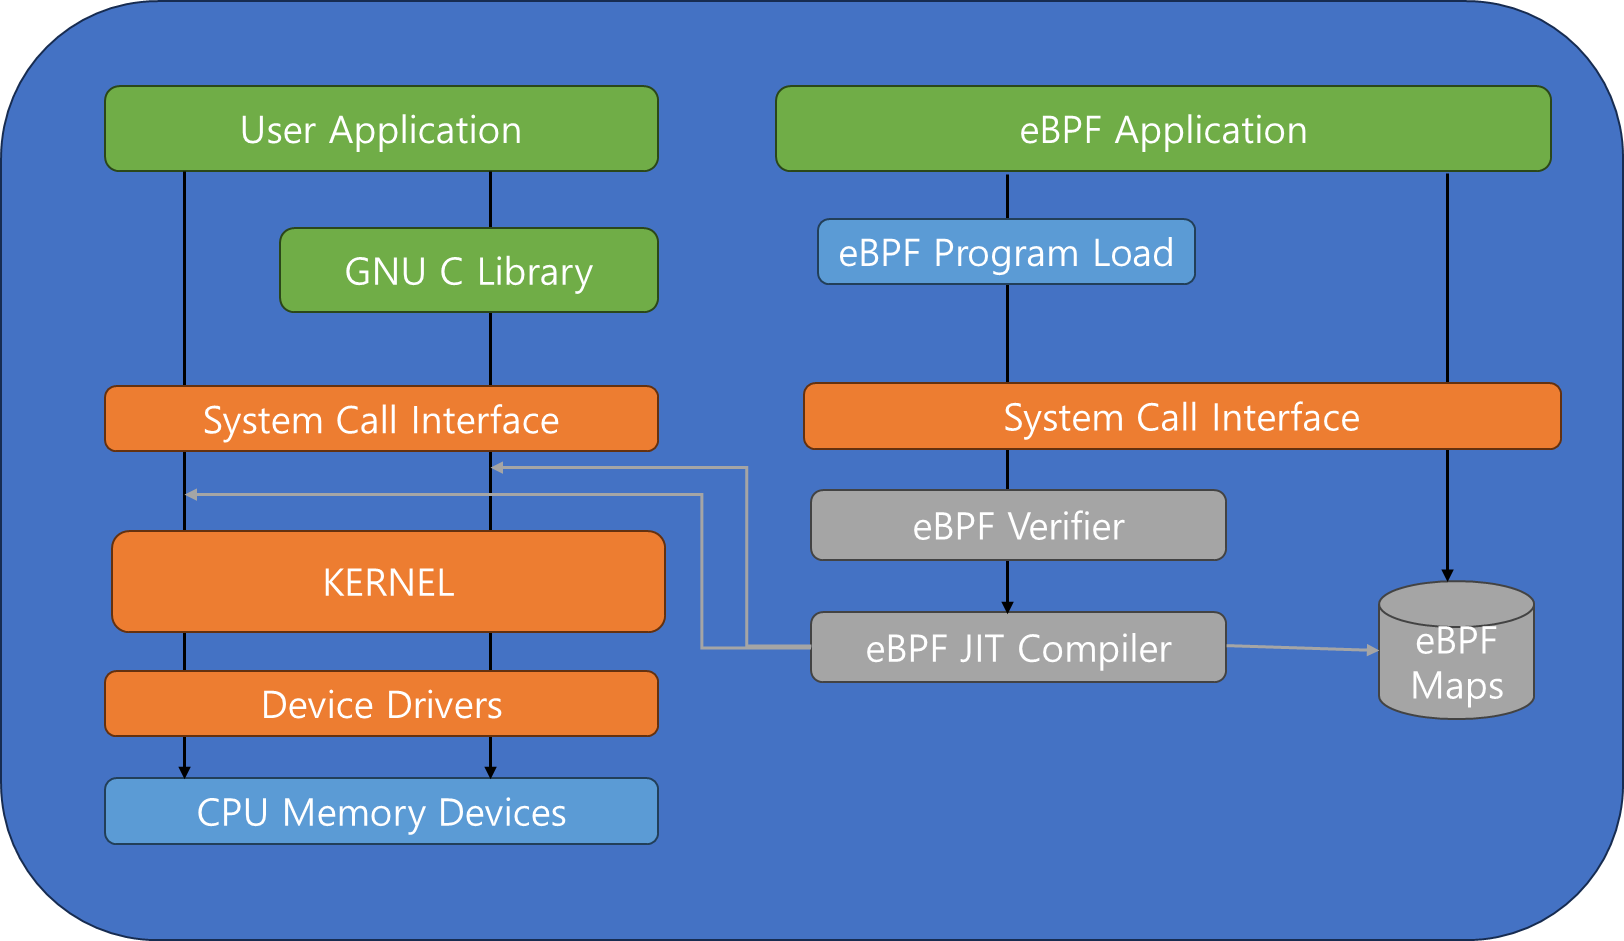
At the beginning of the project, we decided to introduce eBPF technology to network performance monitoring. An abbreviation for Extended Berkeley Packet Filter, eBPF is a powerful tool for capturing and analyzing network events through programs running within the Linux kernel. By applying eBPF, we were able to obtain high accuracy and efficiency in measuring performance.
Golang was chosen as a flexible application language to implement eBPF. Monitoring agents must be able to keep server resources consumption to a minimum in data collection and transmission. Also, since it can be written as a single executable file, complexity can be reduced during installation. eBPF code must be written in a C-family language, but Golang provides a CGO (C Go) package that can call C code. After the eBPF code is written and compiled, it is prepared to be called by Golang.
//example.bpf.c #includeSEC (“kprobe/sys_connect”) int kprobe__sys_connect (struct pt_regs *ctx) {//write eBPF code return 0;}
Loading eBPF in Golang
In Golang, you can load eBPF code using CGO. Include the required header files and use the eBPF code wrapped in Golang functions.
//main.gopackage main/* #cgo CFLAGS: -i/usr/include #include “example.bpf.c” */import “C” func main () {//load and execute eBPF code c.kprobe__sys_connect (nil)}
Network data collection
Golang can use eBPF to capture and analyze network data. Data can be processed as needed, and performance indicators can be extracted and displayed on a monitoring dashboard.

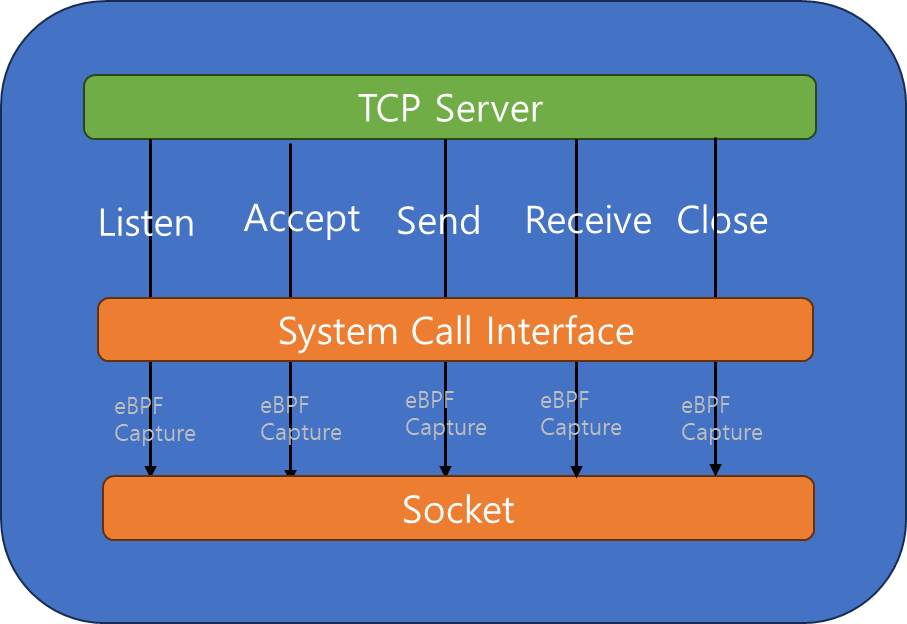
TCP/UDP session performance collection
Using eBPF to measure and collect the performance of TCP/UDP sessions played a key role in the project. Session performance was measured in bytes and packets per second corresponding to bandwidth and the number of jitters, latency, and connections, which indicate health.
Jitter and latency are connection health information, which is a weighted average of the variability of time and time for packets to and from the server to the client. If Jitter and Latency deteriorate, they will affect the real-time operation of session-based servers and clients, such as video conferencing. Additionally, by observing bandwidth usage, it is possible to confirm that the application is operating within the design load range and plan for long-term expansion.
Furthermore, traffic generated by processes responsible for security and management functions was also transparently observed, and individual session loads could be observed separately even in environments where the service network and management network were not separated. When I observed WhaTap's network usage during development, I was very happy to be able to visually confirm that the distributed network was working as designed.
Analysis of connection performance from an application perspective
One of the main goals of this project was to thoroughly analyze connection performance from an application perspective. In particular, when issues such as retransmission occurred, we were able to directly compare and analyze the impact of these issues on applications. We were able to gain insight into the impact by measuring the stability and performance of the connection. I learned how to cross-validate the correlation between the problems users actually feel and connection performance. I usually monitor transactions, CPU, and memory, but the network connection performance was unknown, but I was able to check the number of connections, bandwidth, and especially the frequency of retransmission by applying the product to WhaTap Network. Based on this, we were able to understand the quality of internal networks and simultaneous processing performance requirements when linking external APIs and obtain insights needed for improvement.
Easy visualization of network connection information
While creating the product, we focused on simplifying real-time connection information in a form that humans can understand and delivering performance information. Developers are vaguely aware of load balancing in a real environment or the performance impact of applications in commercial environments where internal and external networks exist simultaneously by developing according to the designed traffic ingress path. The topology was developed with simplified visualization so that developers could understand the network quality and load operating in a real environment. Even people with no network background were able to easily communicate by looking at the topology. For important connections, we tried to improve information transmission by adding a function that emphasizes edges (connections between nodes in a topology).
Concerns about selling products
In order to set sales points when delivering products to customers, PM and developers role-played pre-sales with customers. Through virtual experiences with product presentations and storytelling, we were able to identify customer delivery points as we iteratively derive improvement points in the agile cycle. In particular, since the product is made assuming non-network experts, we set that the message to be delivered to the customer is important from the stage of securing the budget, and tried to make the function match the message. I was able to briefly experience the concerns of sales and marketing personnel.
Watap's network performance monitoring allows non-experts to become network experts
In this project, we learned and applied how to effectively analyze connection performance using eBPF, a new technology. First, with the introduction of eBPF, we were able to achieve high accuracy and efficiency in measuring performance. By flexibly implementing eBPF code using Golang, the performance of the monitoring agent was optimized, and the advantage of being easy to install as a single executable file was utilized.
The project focused on measuring the performance of TCP/UDP sessions and collected bandwidth, bytes and packets per second, and health indicators through jitter and latency. This increased the stability of the session and minimized delays and variability affecting real-time services.
Analyzing connection performance from an application perspective was a particularly important challenge. When problems such as Retransmission occurred, I learned how to compare and analyze the effects directly from user experience. Furthermore, through visualization of network connection performance, it was possible to provide information that both developers and non-experts can easily understand.
Finally, I discovered an important point in communicating with customers through concerns about selling products. It was an opportunity to highlight product strengths through pre-sales role play and identify sales points that are easy to miss while iterating improvements in agile development.
Many people helped me decide to develop an NPM product and launch an actual product. Thank you for your hard work in leading the Network Performance Monitoring project together. Through this project, we were able to learn how to create successful products through technical challenges and collaboration, and gain diverse experiences. More challenges and achievements await in the future. Let's work together to move forward! Thank you
Watap network performance monitoring that turns you into a network expert Learn about Watap network performance monitoring