.svg)
.svg)


Hello, this is WhaTap Labs!
On February 2, 2024, WhaTap's Network Performance Monitoring was officially released. 👏
In the past, network monitoring was operated in the form of obtaining and visualizing information dependent on servers and network equipment through the SNMP protocol. Recently, the network market has been growing in the big framework of cloud and virtualization, which makes it difficult to determine the outage situation and factors with the existing monitoring method. WhaTap's Network Performance Monitoring will solve these difficulties!
In today's post, we will take a look at why you should use Network Performance Monitoring (NPM) and how to use it.
Why is Network Performance Monitoring Necessary?
In recent container-based virtualization environments, multiple containers run on a single machine. Each container has its own network stack, and communication between multiple containers exists even on a single machine. It is difficult to distinguish which container and even which process is causing the problem using traditional equipment-based network monitoring. In addition, on-premise environments where services are run on traditional servers and network equipment are changing to a virtual environment provided by a cloud service provider (CSP). In the cloud, there is no physical entity, so the processes that perform the actual work are the important things to monitor.
This is why cloud and virtualization have created gray zones that traditional network performance monitoring methods fail to track. WhaTap's NPM tracks network behavior on a per-process basis, so you can keep up with changes in your cloud and virtualization environment.
The increasing number of Micro Service Architecture (MSA)-based services and their inherent flexibility and scalability are increasing the complexity of network relationships. The actions taken to stabilize services, such as High Availability (HA) configurations and Scale Out, are also contributing to network complexity. As these relationships become more complex, it becomes increasingly difficult to recognize if a load is occurring and to determine where it is.
That is why network monitoring needs to change from traditional device-centric monitoring to process-centric monitoring. WhaTap's NPM tracks the network actions performed by each process, visualizing complex component and status information in an intuitively understandable way through topology.
What are the benefits of using Network Performance Monitoring?
WhaTap NPM groups complex networks to quickly monitor performance metrics by zone. Topology dashboards provide grouped, simplified network information to quickly identify network failures.
- Reliable and detailed data collection
- WhaTap NPM utilizes eBPF technology to collect data. eBPF technology is a technology that collects various events that occur in the kernel and executes additional behavior in a sandbox environment. Because it collects kernel events, it can obtain detailed information at the process level and can operate reliably because it is sandbox-based.
- Gaining visibility with tagging options
- Network monitoring products need to make diverse and complex network data easy to understand. WhaTap NPM supports tagging options to help users represent network elements according to their purpose and intent. They can be customized to suit the nature of the customer service.
- Troubleshooting with raw data
- Even if you do not access the server, you can view the status of your network at any point in time based on metrics, even after an outage is resolved, and we will help identify the issue, including the servers and processes involved.
- In addition, because metrics are collected on a per-process basis, you can expect the following effects.
- Identifying and improving service dependencies
- Because we collect metrics on a per-process basis, you can drill down into service dependencies by segment. Not only can you see how your services are dependent on each other, but you can also see specifically where they are less efficient so you can improve them.
- Optimizing network costs
- Cloud and MSAs, which are trending recently, have inherently high network costs. WhaTap NPM collects metrics on a per-process basis, so you can see where unintended traffic loads are occurring. You can set up an optimal network environment, which can reduce network costs.
- Reducing MTTD, MTTR for Network Outages
- MTTD(Mean Time To Detect, Time taken to detect outage) / MTTR(Mean Time To Repair, Time taken to repair outage after detecting it) Traditionally, network monitoring has been host-based, which makes it difficult to identify which process or container is causing a problem in a network situation that you may not have been able to pinpoint. You do not have to go to the server to identify it, reducing the time to detect and repair an outage.
How can I utilize Network Performance Monitoring?
Let's take a look at the Network Performance Monitoring screen and find out!
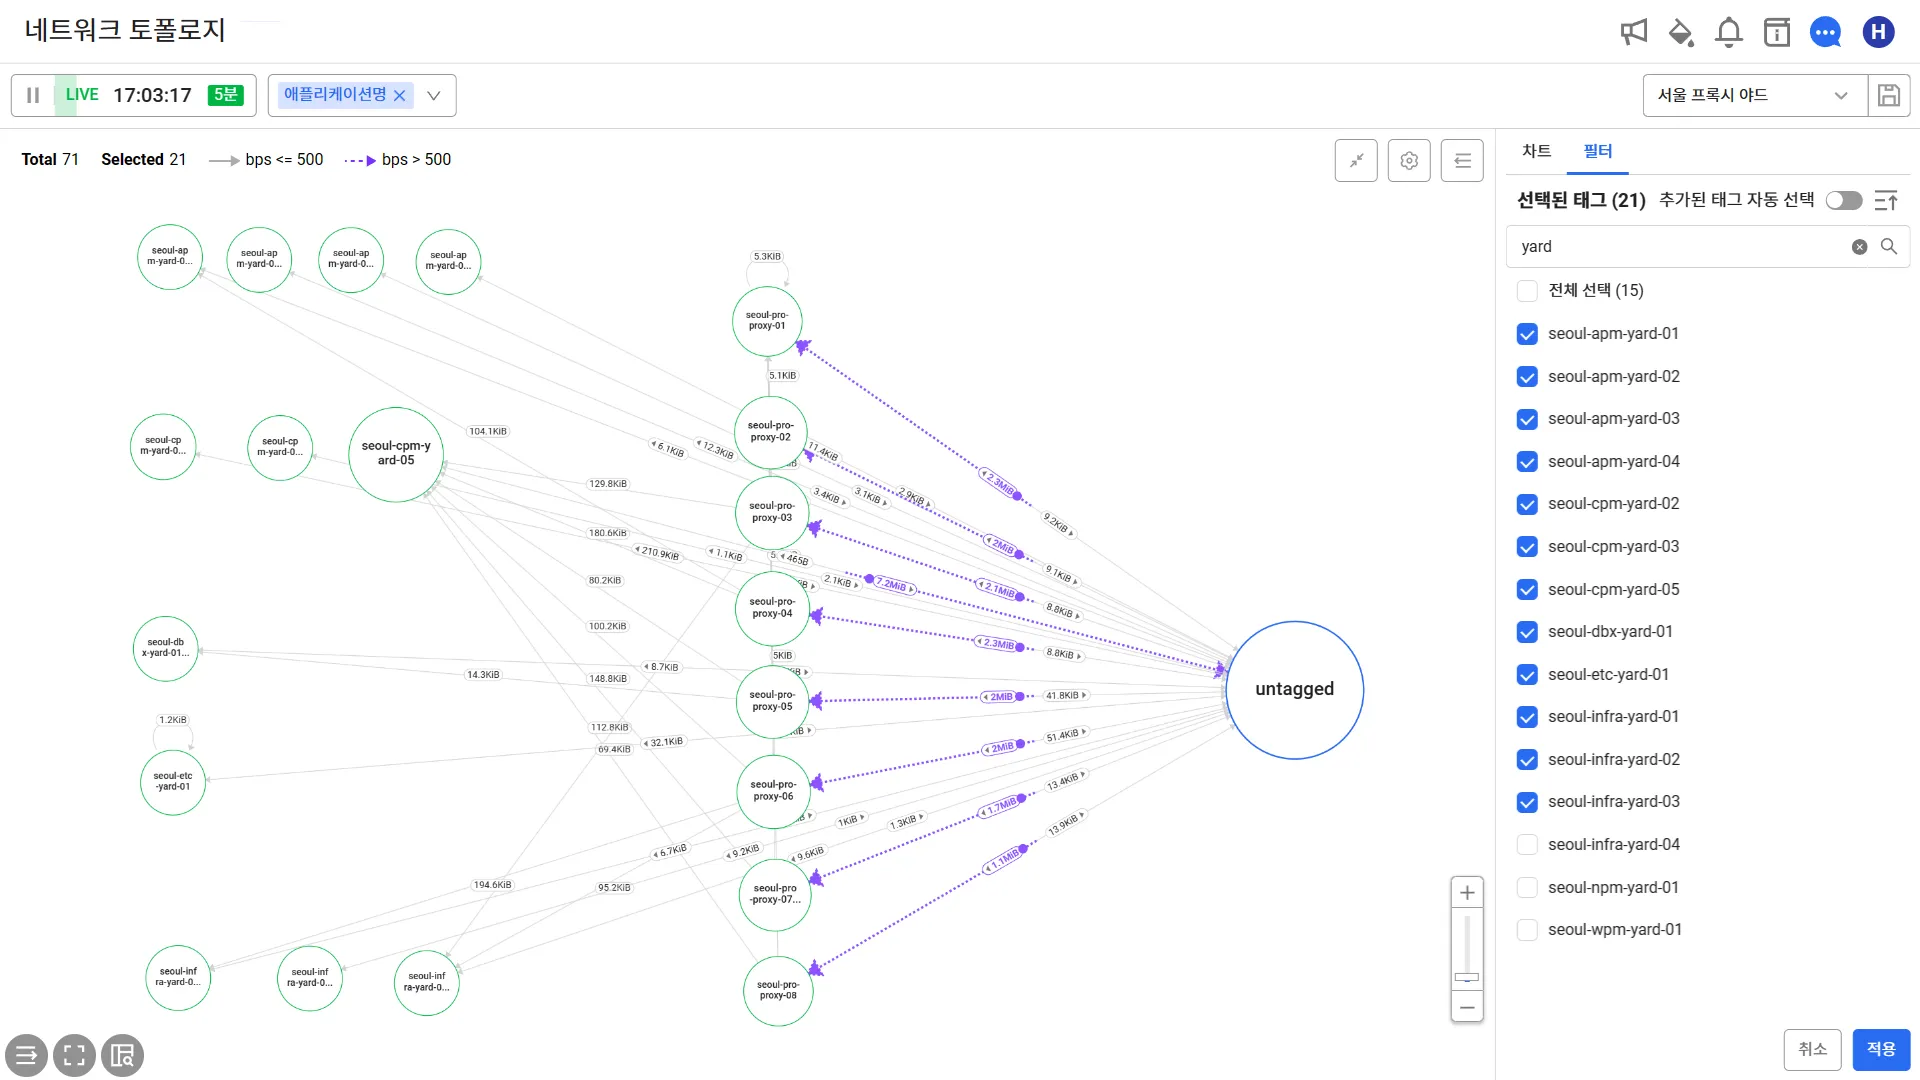
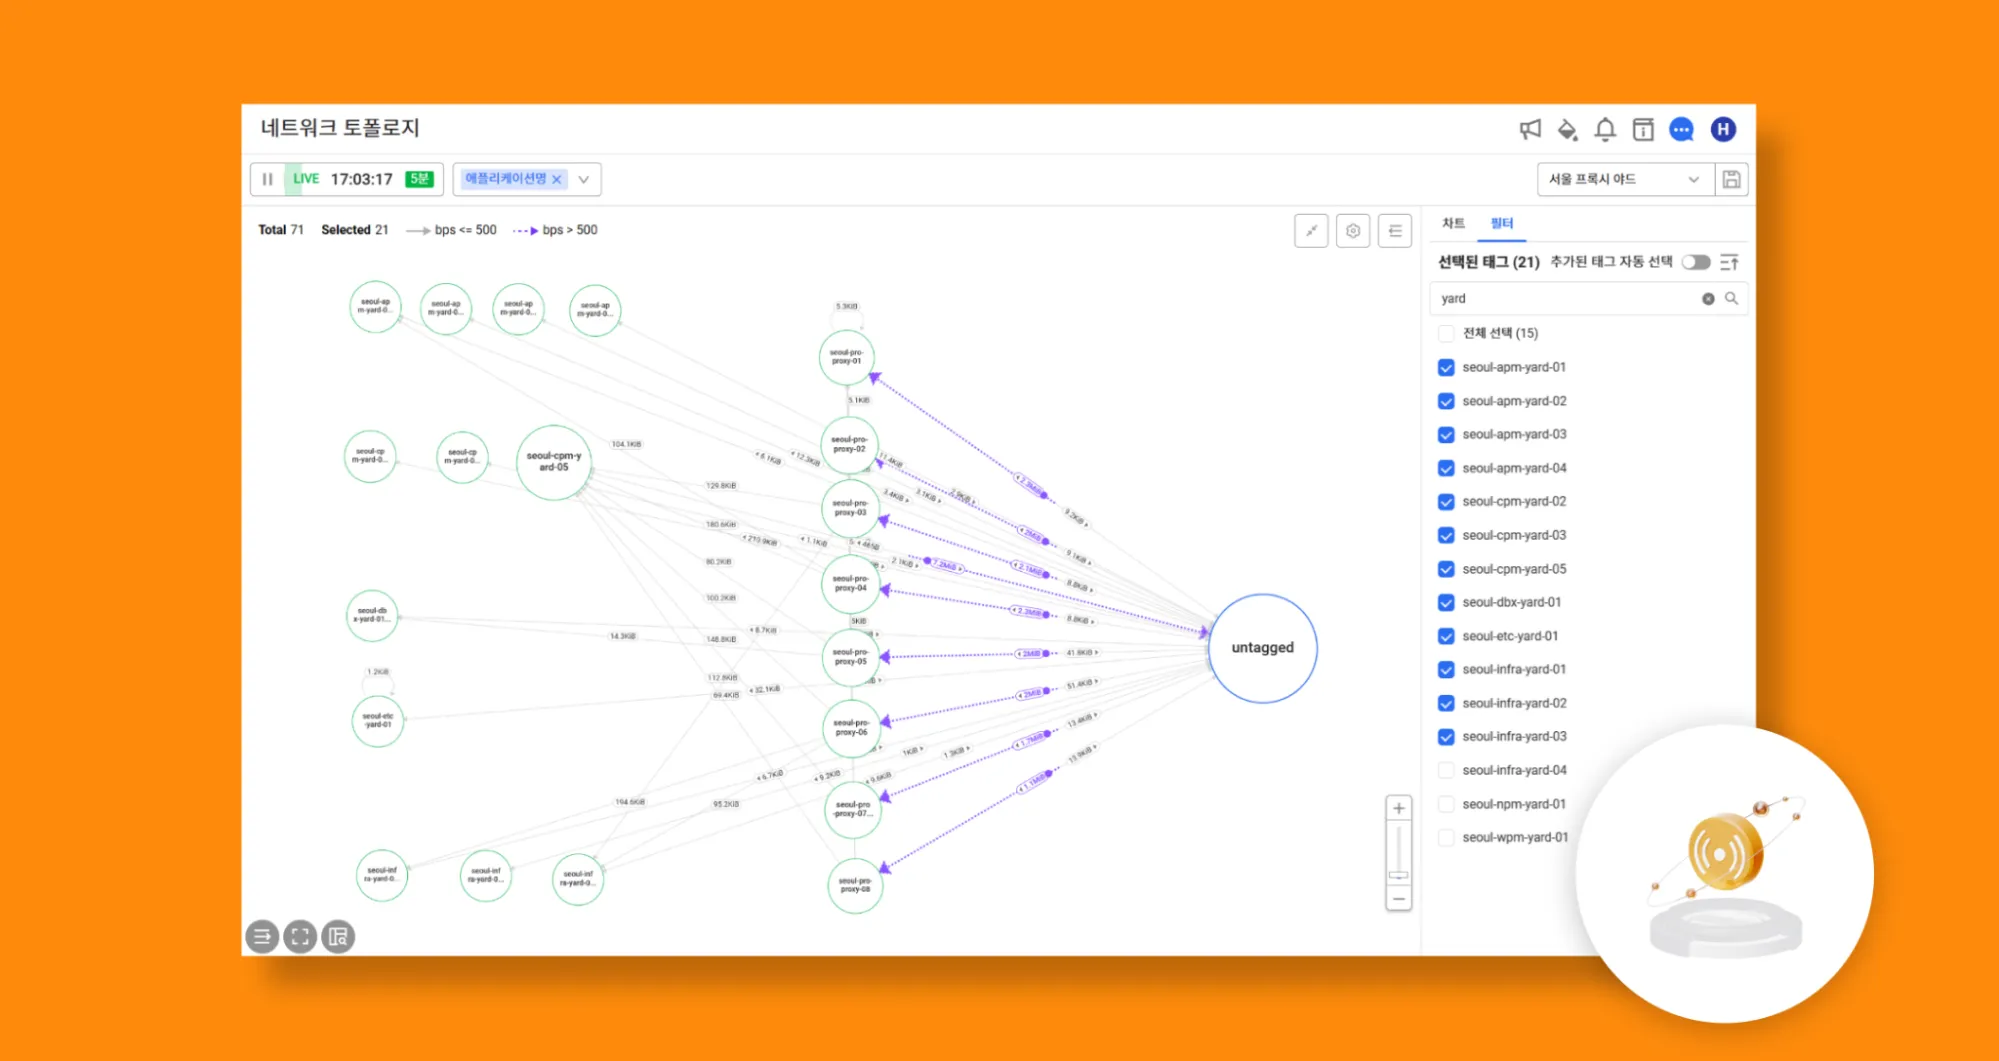
1. Network Topology
The Network Topology menu provides a topology chart that shows the relationships between nodes at a glance and, in conjunction with linear charts by metric, allows you to quickly see the performance of sections of your network.
Topology is a chart that depicts your network in terms of nodes and edges. It can be paired with time series charts for each performance metric to more easily pinpoint network bottlenecks or failures. You can view data in real time and for specific periods in the past, and you can visualize and monitor the performance of your abstracted network based on "process type" or "application" tags.
2. Network Trends (TCP)
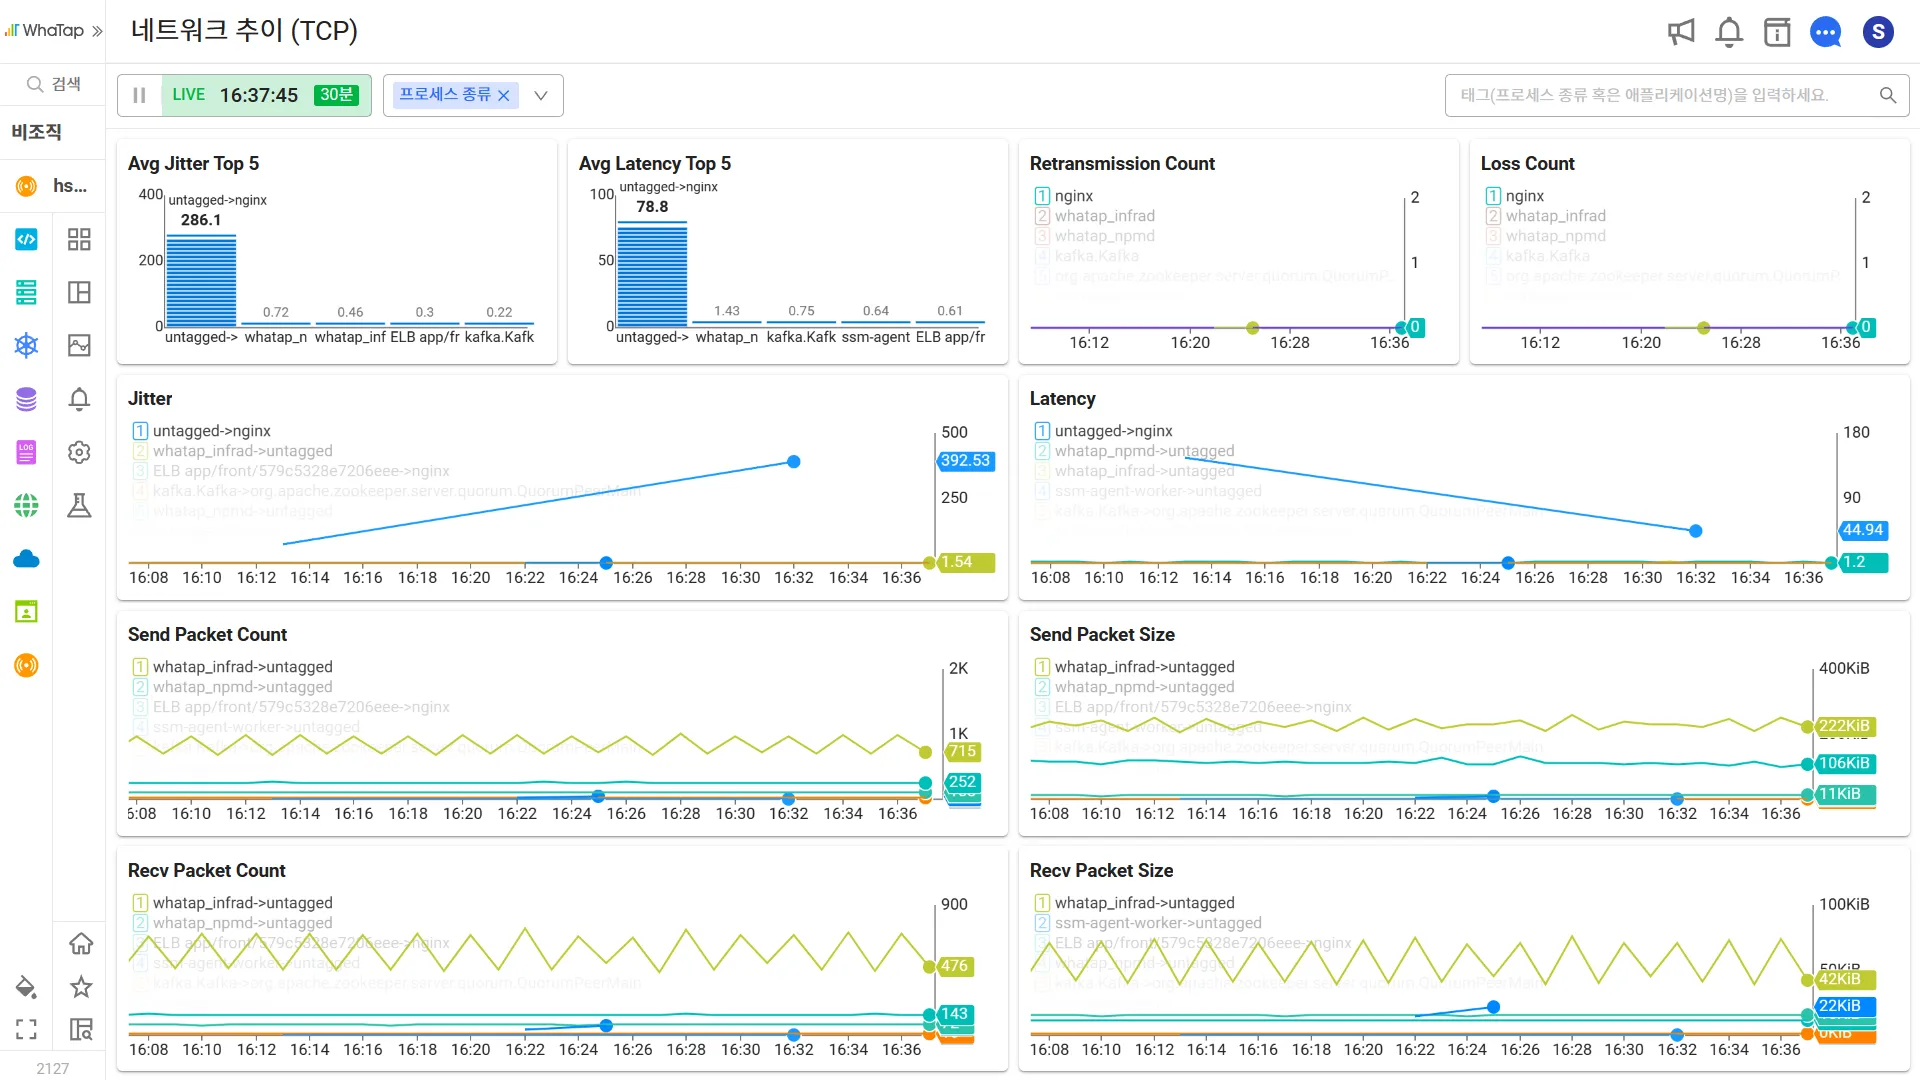
While the Network Topology menu is all about visualizing network configuration information, the Network Trends (TCP) menu provides a dense view of numerical performance information on a single screen. You can view performance information over time in real time, and you can also view performance information from historical points in time to analyze issues.
3. TCP Session / UDP Session
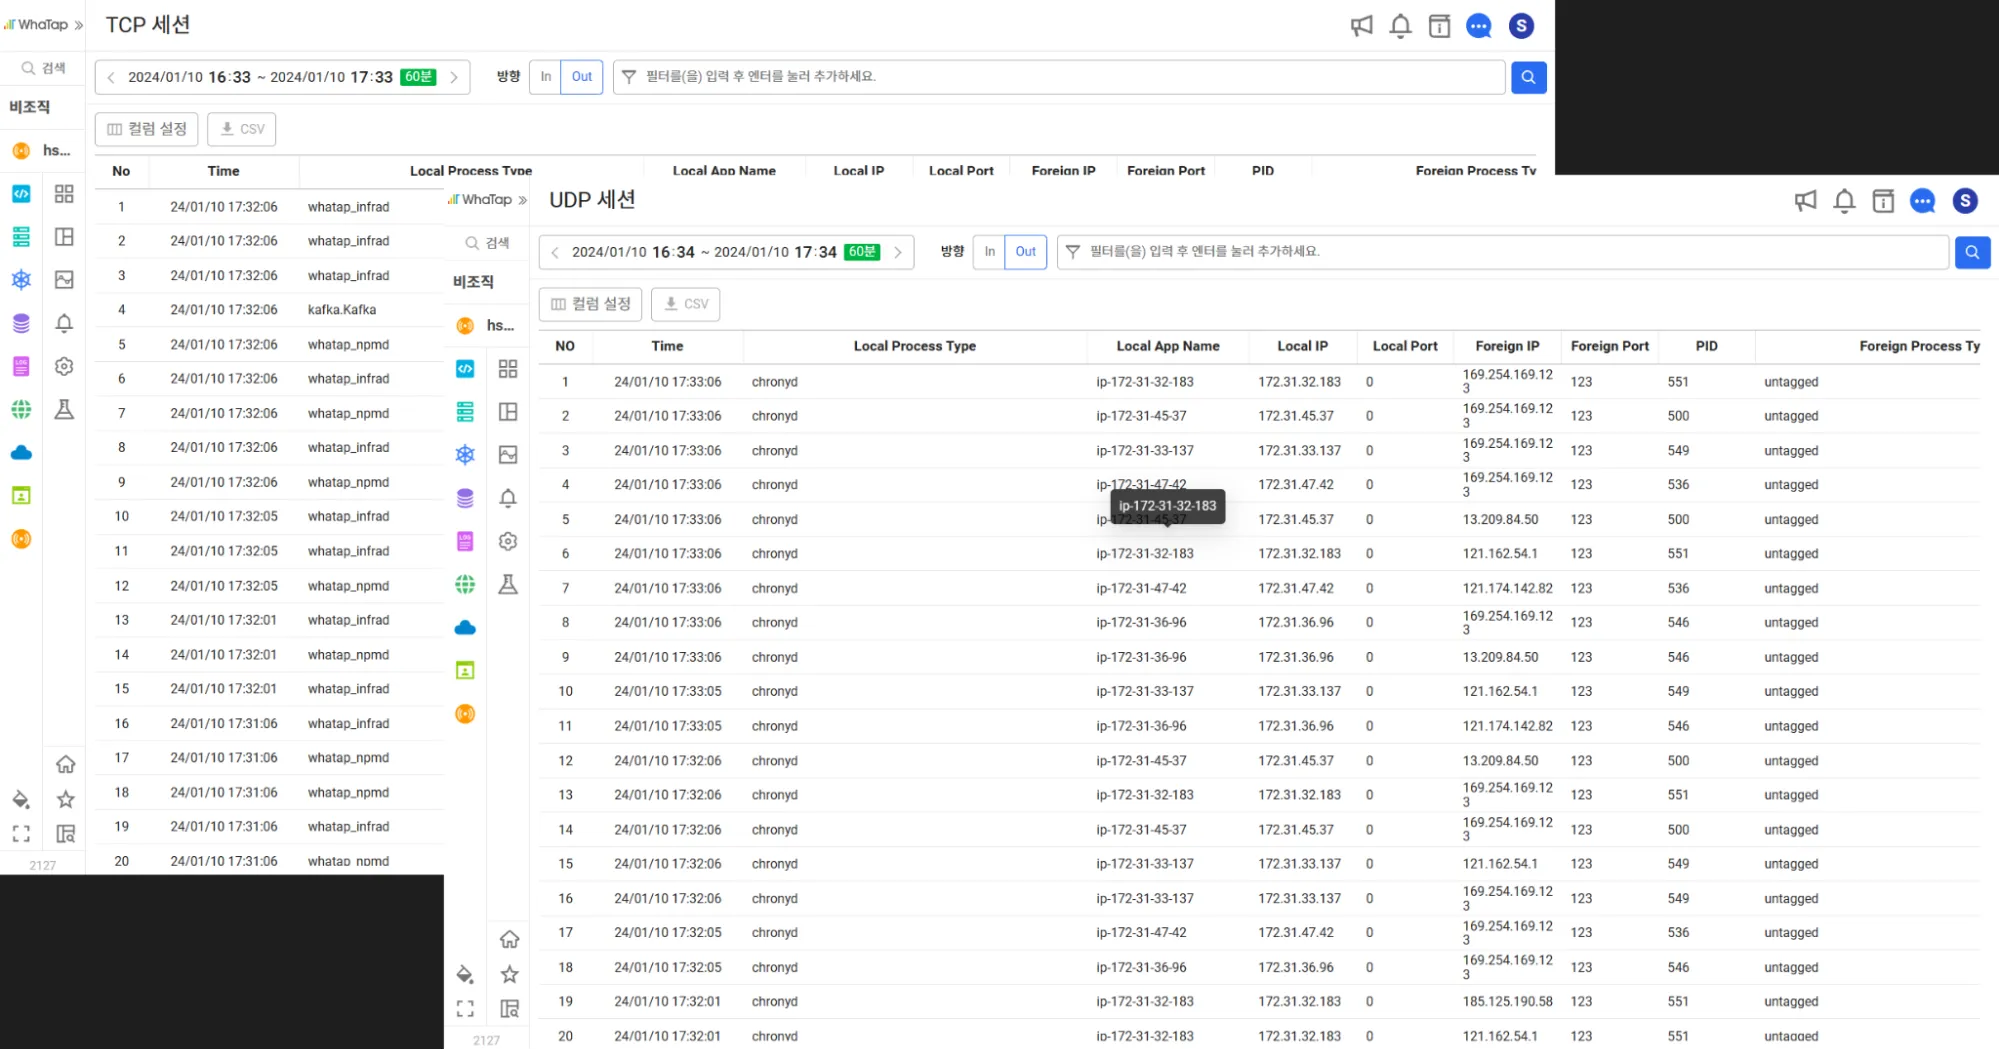
The TCP Session / UDP Session menu allows you to use the session data collected by the agent to identify outage points in detail. It provides a filter feature that allows you to set multiple conditions to identify data efficiently. The data you identify can be downloaded in CSV file format so that you can utilize it as a separate resource.
How can I utilize each metric?
1. Quality metrics
The WhaTap NPM provides Latency and Jitter metrics. These can be used as a baseline for determining performance issues and outages, and can be collected in cases that utilize TCP-based network communication.
- Latency: A metric that refers to network response time. Segments with high response times can directly result in a poor experience for end users.
- Jitter: A metric that refers to the variability of network response time. A high Jitter value can be interpreted as network congestion in that segment, frequent changes in the path of packet travel, which may indicate a failure of a particular network segment. It can point to a failure in a particular network segment, and it can also cause packet arrival order to be jumbled, leading to packet retransmissions and leaks, resulting in a degradation of overall quality of service.
2. Network Usage Metrics
It provides information about network usage and can be used to optimize your cloud environment through unintended influx of external traffic (such as DDoS) or traffic patterns.
- bps: bits per second (bps) is a metric that indicates the number of bits transmitted per second.
- pps: packets per second (pps) is a metric that indicates the number of packets sent per second.
- session count: This metric shows the number of unique sessions.
We hope you enjoyed this introduction to WhaTap's new Network Performance Monitoring! If you are interested, you can try it out for free for 15 days by creating an NPM project now!


