.svg)
.svg)


Network Performance Monitoring development retrospective: Analyzing connection performance with eBPF
Hello, I am going to give a retrospective on my experience and achievements leading the Network Performance Monitoring project as a project manager. This project took a total of a year of challenges and collaboration, and I will show you how our group was able to solve technical issues and successfully launch the product.
Introducing eBPF technology
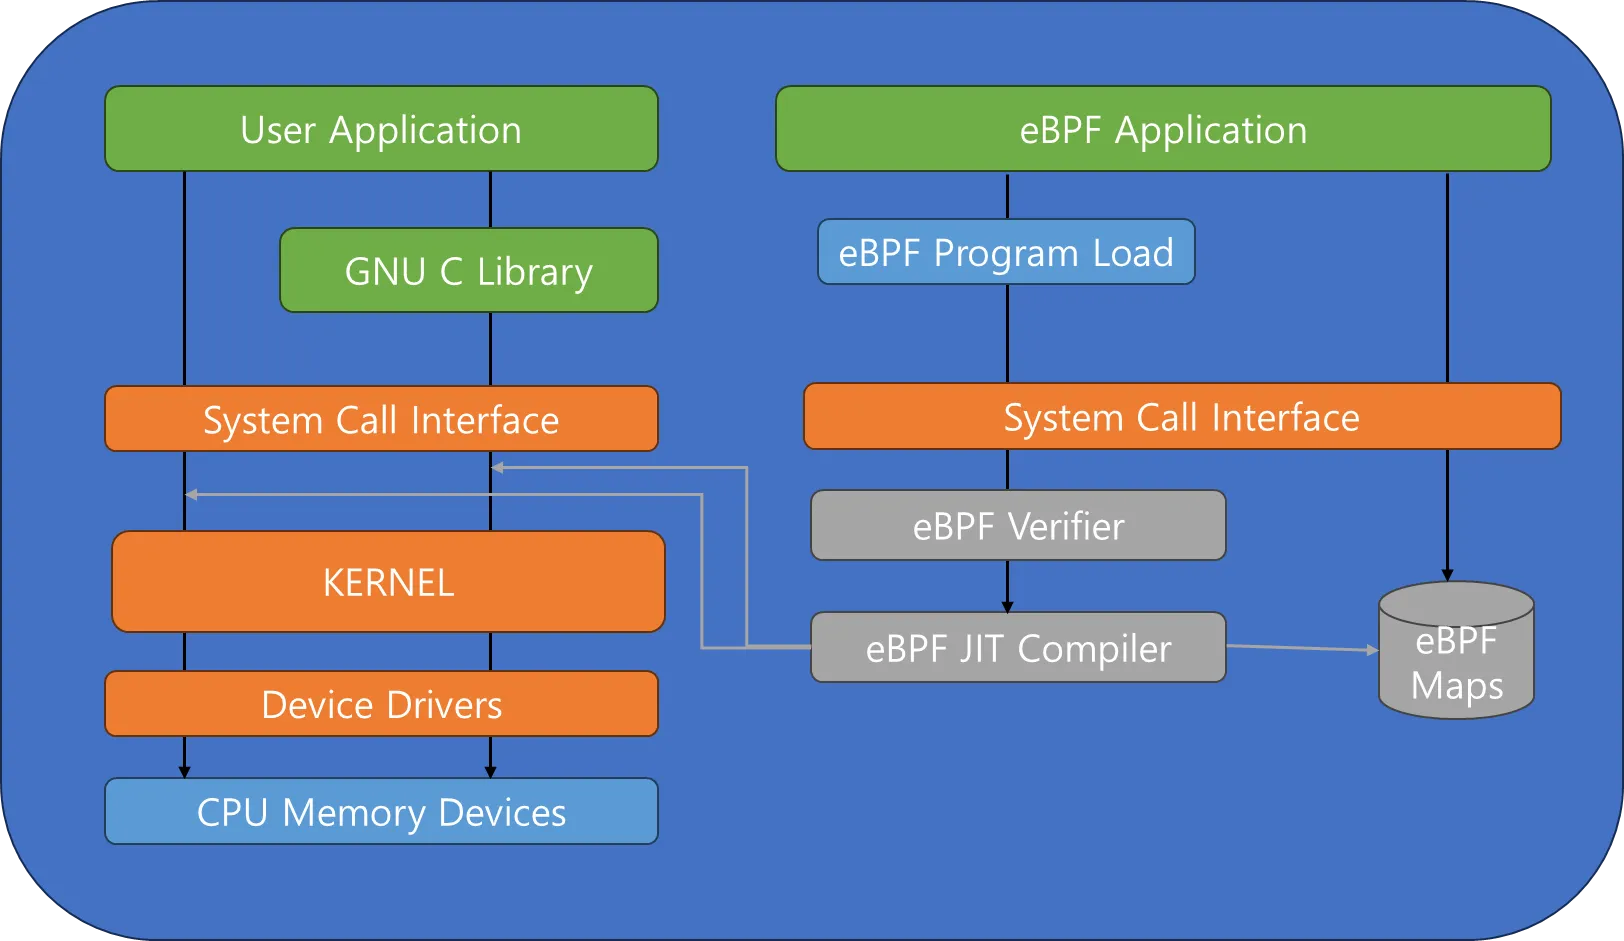
Early in the project, we decided to adopt eBPF technology for Network Performance Monitoring. Short for Extended Berkeley Packet Filter, eBPF is a powerful tool that allows us to capture and analyze network events through a program that runs within the Linux kernel. By applying eBPF, we were able to achieve high accuracy and efficiency in measuring performance.
We chose Golang as a flexible application language to implement eBPF. The monitoring agent should be able to keep the server resources consumed by data collection and transmission to a minimum. It can also be written as a single executable file, which reduces complexity during installation. The eBPF code must be written in a C-like language, but Golang provides a C Go (CGO) package that allows you to call C code. After you have written and compiled your eBPF code, prepare it to be called by Golang.
// example.bpf.c
#include
SEC("kprobe/sys_connect")
int kprobe__sys_connect(struct pt_regs *ctx) {
// eBPF write code
return 0;
Loading eBPF in Golang
In Golang, you can load eBPF code using CGO. It includes the necessary header files, wraps the eBPF code in a Golang function, and uses it.
// main.go
package main
/*
#cgo CFLAGS: -I/usr/include
#include "example.bpf.c"
*/
import "C"
func main() {
// eBPF load and run code
C.kprobe__sys_connect(nil)
}
Collecting network data
In Golang, you can use eBPF to capture and analyze network data. You can process data as needed, extract performance metrics, and display them in monitoring dashboards.
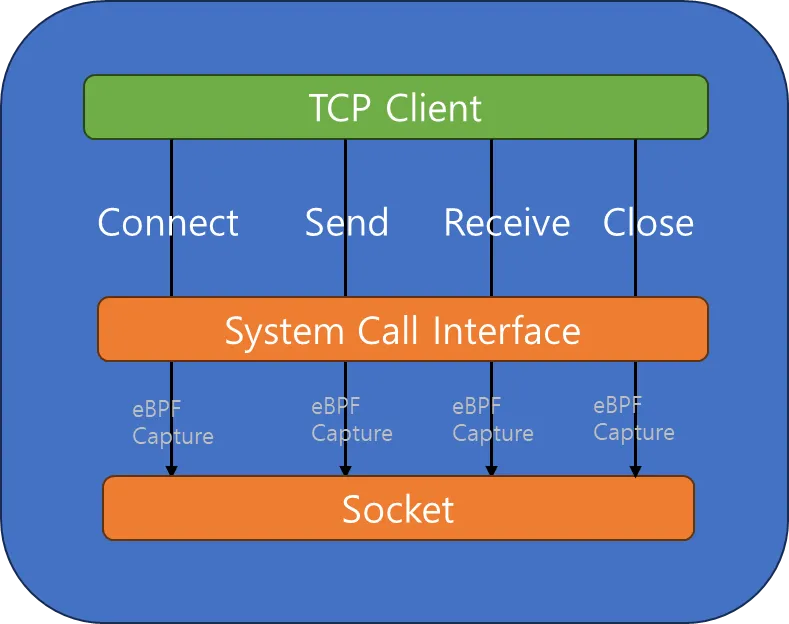
Collecting TCP/UDP session performance
Leveraging eBPF to measure and collect the performance of TCP/UDP sessions was a key part of the project. The performance of the sessions were metered in terms of bytes and packets per second, which corresponds to bandwidth, and jitter, latency, and connection count, which indicates the health of the connection.
Jitter, latency is the health information of a connection, a weighted average of the time it takes packets to travel to and from the server and client and the variability in that time. When jitter and latency deteriorate, they affect real-time, session-based operation of servers and clients, such as video conferencing. By observing bandwidth usage, you can also ensure that your application is operating at its design load range and plan for long-term scaling.
Traffic generated by processes responsible for security or management features was also transparently observed, allowing us to observe individual session loads even in environments where the service and management networks were not separated. When we observed WhaTap's network usage during development, we were excited to be able to visually confirm that our distributed network was working as designed.
Analyzing connection performance from an application perspective
One of the main goals of this project was to thoroughly analyze connection performance from an application perspective. Specifically, when issues like retransmission occurred, we were able to directly compare and analyze the impact of these issues on the application. By measuring the reliability and performance of the connection, we were able to gain insight into what the impact was. We learned how to cross-validate the correlation between the issues users are experiencing and the performance of their connections. Transactions, CPU, and memory are usually monitored, but we did not know the performance of the network connections. By applying the product to the WhaTap network, we were able to see the number of connections, bandwidth, and especially the frequency of retransmissions. This gave us insight into the quality of our internal network and the concurrency performance requirements when connecting to external APIs.
Easily visualize network connectivity
While creating the product, we focused on simplifying real-time connectivity information and communicating performance information in a human-understandable form. Developers are often tied to designed trap ingress paths and have only a vague idea of the performance impact of their applications in real-world load balancing or in commercial environments where internal and external networks exist simultaneously. We developed topologies with simplified visualizations to help developers understand network quality and load as it operates in the real world. People without a networking background could easily communicate with the topology. We tried to make the information more communicative by highlighting edges (the connections between nodes in the topology) for critical connections.
Thinking about selling the product
To establish selling points when delivering the product to clients, PMs and developers role-played a pre-sale with a client. The virtual experience of product presentation and storytelling helped us identify client delivery points as we iterated on improvement points in the agile cycle. Especially since we were building a product for lay people, we decided from the budgeting stage that the message to the client was important and worked to ensure that the features aligned with the message. We were able to feel the pain of sales and marketing for a short time.
How WhaTap's Network Performance Monitoring Enables Non-Experts to Become Network Experts
In this project, we learned and applied a new technology, eBPF, to effectively analyze connection performance. Initially, the introduction of eBPF enabled us to achieve high accuracy and efficiency in performance measurement. By leveraging Golang, we had the flexibility to implement the eBPF code to optimize the performance of our monitoring agent, and we took advantage of the ease of installation with a single executable file.
The project focused on measuring the performance of TCP/UDP sessions, collecting health metrics in terms of bandwidth, bytes and packets per second, and jitter and latency. This allowed us to increase the reliability of the sessions and minimize the delays and variability that affect real-time services.
Analyzing connection performance from an application perspective was particularly important. When issues such as retransmissions occurred, we learned how to compare and analyze the impact directly into user experience. Visualizations of network connection performance also provided information that was easily understood by developers and non-expert users alike.
Finally, by thinking about how to sell the product, we discovered important points in communicating with customers. The pre-sales role-play helped us highlight the strengths of the product and identify selling points that are easy to miss while iterating in agile development.
Many people helped us get from the decision to develop an NPM product to the actual product launch. Thank you for all your hard work in leading the Network Performance Monitoring project together. Through this project, we have gained a lot of experience and learned how to create a successful product through technical challenges and collaboration. We look forward to more challenges and accomplishments in the future. Let's move forward together! Thank you.


