.svg)
.svg)


How to monitor asynchronous applications
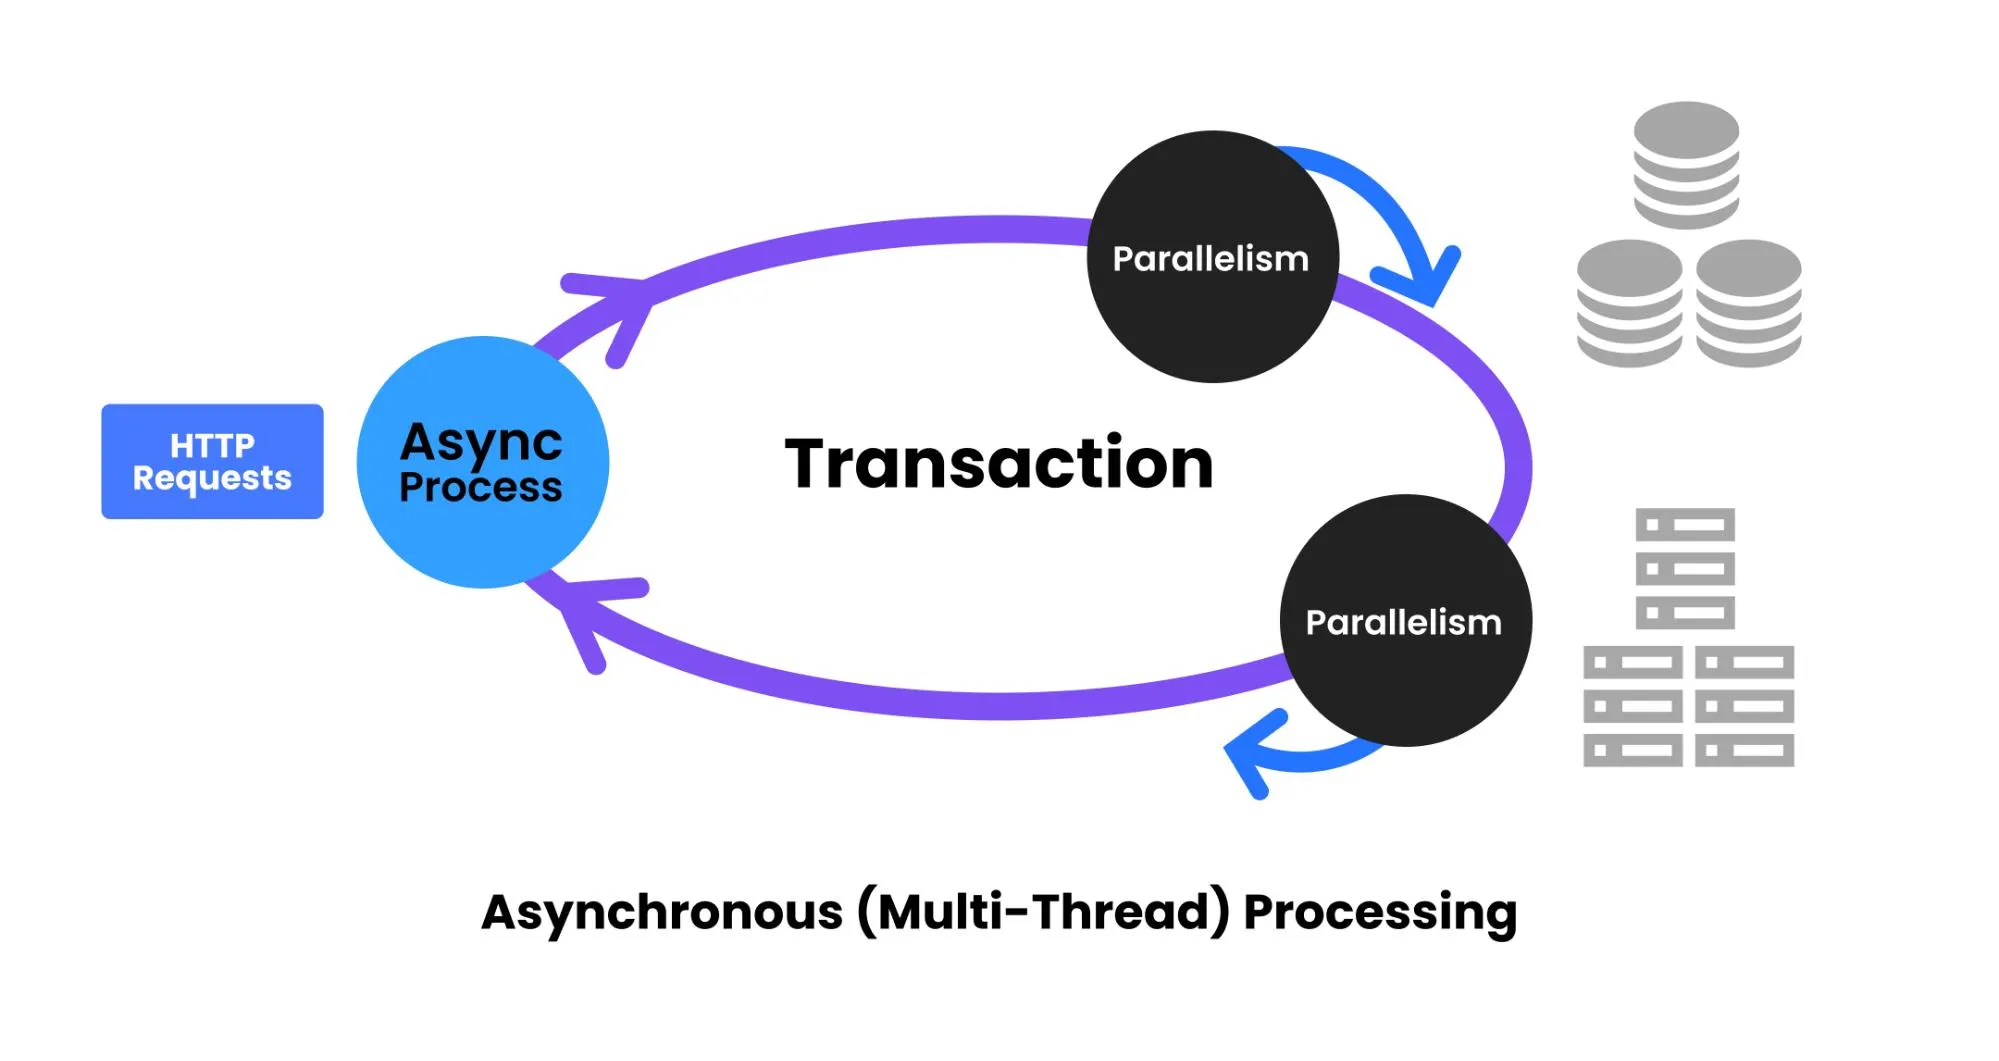
Asynchronous applications can perform multiple tasks at the same time, allowing other tasks to proceed while one task completes. This can reduce the processing time of the entire operation and improve the user experience.
Asynchronous methods are more complex than synchronous, but they have the advantage of using resources efficiently because even if it takes a while to get a result, you can do something else during that time. The distributed, event-driven nature of asynchronous applications has many advantages in terms of efficiency, but it also adds complexity, which makes monitoring applications challenging. Some of the challenges of monitoring asynchronous applications include the following.
Why is monitoring asynchronous applications difficult?
- Difficult to trace sequentially: Asynchronous workflows do not follow a linear, sequential path, making it difficult to trace the flow of execution. Traditional monitoring tools may not provide a clear end-to-end view of application processes.
- Complex event handling: Asynchronous applications often contain complex event-driven architectures with many interrelated events and triggers. Monitoring these events and their dependencies can be challenging, as well as understanding how they affect application performance.
- Scalability and parallelism: Asynchronous applications are designed to handle high levels of concurrency and parallelism. Monitoring tools should scale appropriately to collect data from multiple concurrent processes and threads without impacting performance.
- Latency and asynchronous calls: Tracking latency in asynchronous workflows can be tricky. Because asynchronous tasks can involve multiple steps and wait times, it can be more difficult to measure how long they take to complete than synchronous tasks.
- Granularity of data: While some monitoring tools can provide high-level metrics, it can also be difficult to understand the granular details within asynchronous workflows. A tool that can capture detailed data about the execution of asynchronous jobs is essential.
- Event ordering: Ensuring the correct ordering of events in asynchronous systems is critical. Monitoring tools should help you identify and resolve issues related to out-of-order or delayed events.
- Identify bottlenecks: Detecting performance bottlenecks in asynchronous systems can be complex, as slowdowns can occur in multiple parts of the workflow. Effective monitoring should help pinpoint the exact location of the bottleneck.
- Error handling and exception tracking: Handling errors and exceptions in asynchronous applications is a challenging task because errors can propagate asynchronously. Monitoring tools should provide insight into error handling and help you identify and resolve issues.
- Distributed systems: Asynchronous applications often include distributed systems with multiple components running on different servers. Monitoring these distributed components and tracking their interactions can be complex.
- Long-running tasks: Some asynchronous tasks can run for long periods of time, and monitoring the resource consumption and health of these long-running tasks can be critical to maintaining application performance.
- Data volume and retention: Asynchronous applications can generate significant amounts of data, especially in event logs. Monitoring tools should handle the volume of data generated and provide mechanisms for data retention and aggregation.
- Anomaly detection: Identifying anomalies in asynchronous applications can be challenging because the expected behavior may not be well defined. Monitoring tools should use advanced anomaly detection techniques to identify unexpected patterns and deviations from the norm.
To solve these problems, you need to use a solution that enables transaction tracing for asynchronous applications. How does the WhaTap application enable distributed tracing of asynchronous applications?
How does WhaTap support asynchronous application monitoring?
WhaTap tracks open source libraries or frameworks by manipulating Java bytecode. For example, to trace spring-webflux based on reactor, we add tracing code to the open source library by manipulating bytecode and utilizing the Operator provided by the reactor library to trace transactions.
When you configure your application asynchronously, you often utilize multiple asynchronous open source libraries in a single transaction. For example, a spring-boot web transaction often calls tomcat, spring-cloud-gateway, redis, kafka, r2dbc, etc. In this case, WhaTap JavaAgent adds tracing code to each open source library so that you can monitor asynchronous transactions by linking and tracing them.
1. How to trace external frameworks or open source in WhaTap
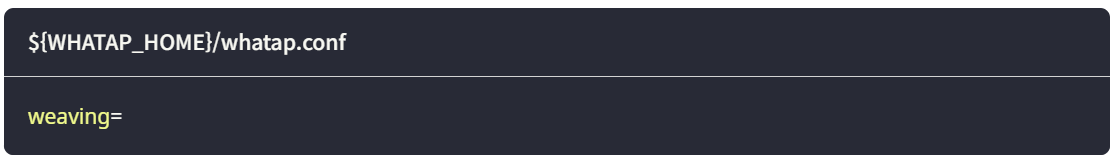
If the user’s application uses frameworks or open source, we provide a setting to track them through the Whatap Java agent. You can do this by adding the weaving option to the Java agent settings file (whatap.conf).
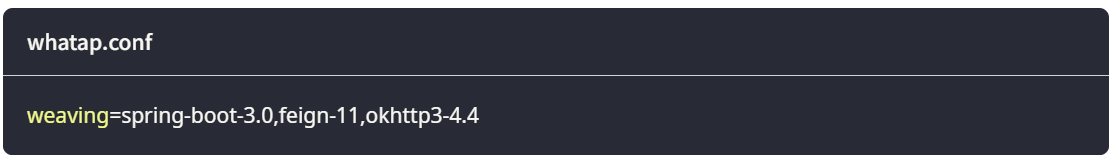
If you are using spring-boot-3.x, feign-client-11, okhttp3-4.4 as your framework or open source, as in the example above, set the options as follows.
For additional frameworks or open source resources that WhaTap can track, please see the WhaTap Docs link.
See also: Frameworks/Open Source that WhaTap supports for link tracking
2. How to track a custom CompletableFuture linkage in a Java application
1. Add a CompletableFuture method
Add a CompletableFuture method to your Java application project that you want to hook into as an agent.
- Method Name: Unify as trace
- ReturnType: Supplier, Consumer, Runnable, Future
package io.home.test.util;
import java.util.concurrent.Future;
import java.util.function.Consumer;
import java.util.function.Supplier;
publicclass W {
publicstatic Supplier trace(Supplier f) {
return f;
}
publicstatic Consumer trace(Consumer f) {
return f;
}
publicstatic Runnable trace(Runnable f) {
return f;
}
publicstatic Future trace(Future f) {
return f;
}
}
2. Add agent settings
Add the following options to your whatap.conf file for agent settings.
whatap.conf
hook_completablefuture_patterns=io.home.test.util.W.*
- If you have Context, add the trace method to hook the transaction.
- If you do not have Context, you will need to start the service with the hook_service_patterns option.
3. Usage Examples
- Original
public CompletableFuture serviceATimeout() {
return CompletableFuture.supplyAsync(() -> {
RestTemplate restTemplate =new RestTemplate();
return restTemplate.getForObject("http://localhost:8081/api/serviceB/timeout", String.class);
});
}
- io.home.test.util.W.trace() apply
// io.home.test.util.W.trace() apply
public CompletableFuture serviceATimeout() {
return CompletableFuture.supplyAsync(W.trace(() -> {
RestTemplate restTemplate =new RestTemplate();
return restTemplate.getForObject("http://localhost:8081/api/serviceB/timeout", String.class);
}));
}
If asynchronous applications have been difficult to track, try WhaTap application monitoring. WhaTap gives you real-time insights into your metrics so you can troubleshoot issues and optimize the performance of your asynchronous applications.


