.svg)
.svg)


In this November newsletter, we're celebrating the one-year anniversary of log monitoring and taking a look at some of the additional features that have evolved over the past year. You can check out how we introduced log monitoring in last year's November newsletter to get a better idea of how integrated log monitoring is possible.
Integrated log monitoring, why do it?
Traditional log monitoring methods require the inconvenience of accessing individual servers through terminals to view the logs output by the servers. However, if you implement a integrated log monitoring system, you can achieve the following benefits.
- The convenience of being able to view the contents of logs centrally without having to access individual servers.
- Viewing logs through an on-screen UI provides quick and easy access to error and issue information. This accessibility allows early detection of failures.
- We can reduce the average time to resolve failures and quickly resolve incidents in our production environment.
Application environments are moving to the cloud, and MSA environments or Kubernetes environments are becoming more common. The change in service deployment environment has led to an increase in the number of resources to be managed.
Integrated log monitoring that minimizes the hassle of accessing individual servers or containers one by one is essential in this process. In addition, loading logs on individual servers can lead to excessive occupation of file system capacity due to logs. In such cases, measures are needed to ensure that log files do not exceed a certain size, such as limiting the maximum load size. However, if you collect logs centrally, you don't need to maintain log files on individual servers, so you only need to manage the retention period of centrally loaded log data.
Efficient log analysis
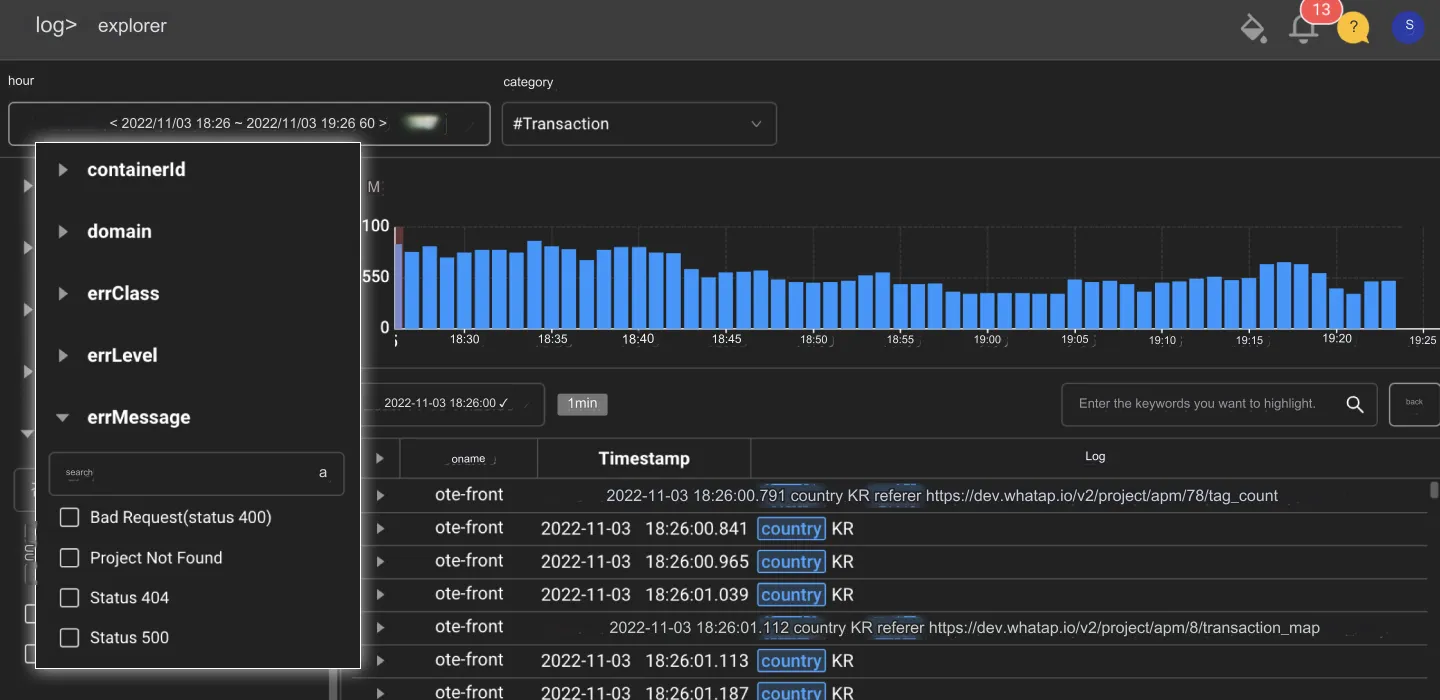
With WhaTap Log Monitoring, you can categorize logs for statistical purposes and check the trend of the number of log occurrences in a specific unit. If the number of log occurrences is closely correlated with the timing of the failure and its resolution, the trend of log occurrences can be used to identify early warning signs of a failure.
WhaTap Log Monitoring is now even more powerful
It's been a year since we launched Log Monitoring, and we've been working hard to make it even better.
- We have added the ability to search logs even in a server environment.
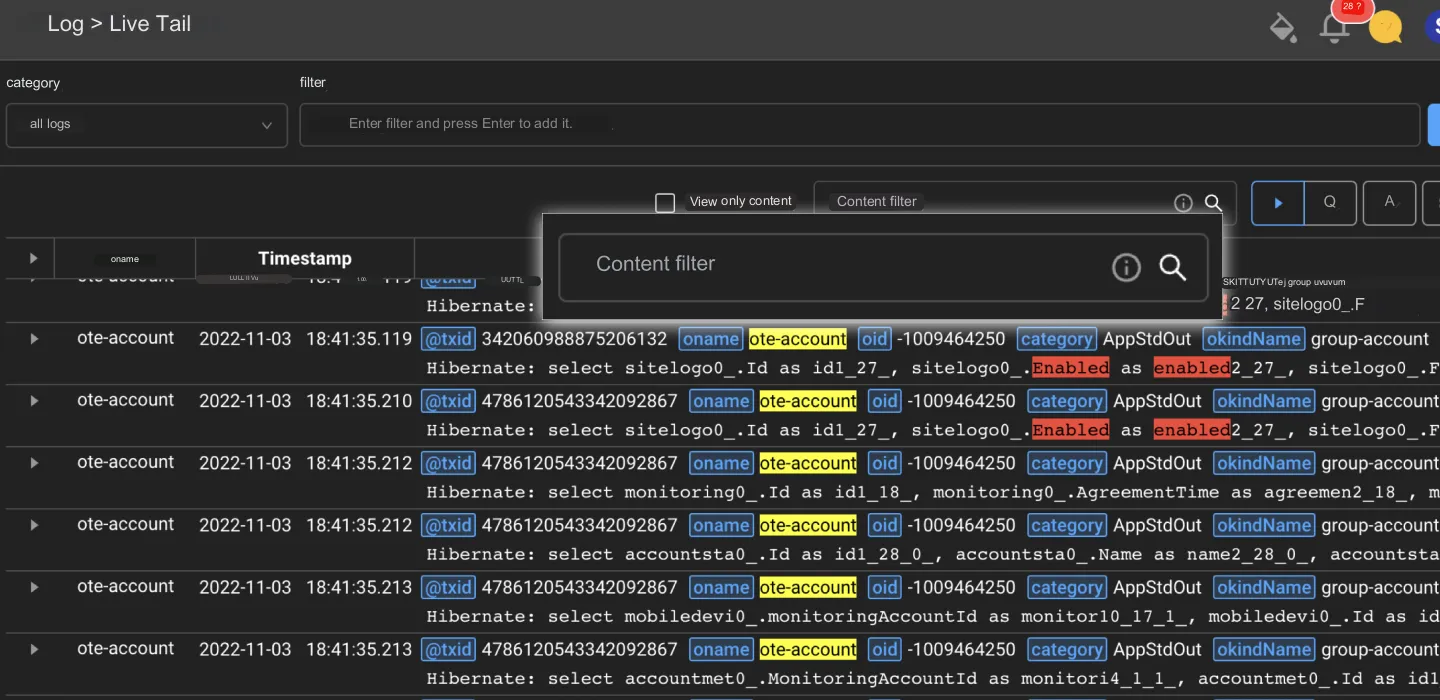
- We added a filter function to Live Tail to improve user convenience.
- Added case-sensitive search, reverse chronological viewing options, and more to the log searcher.
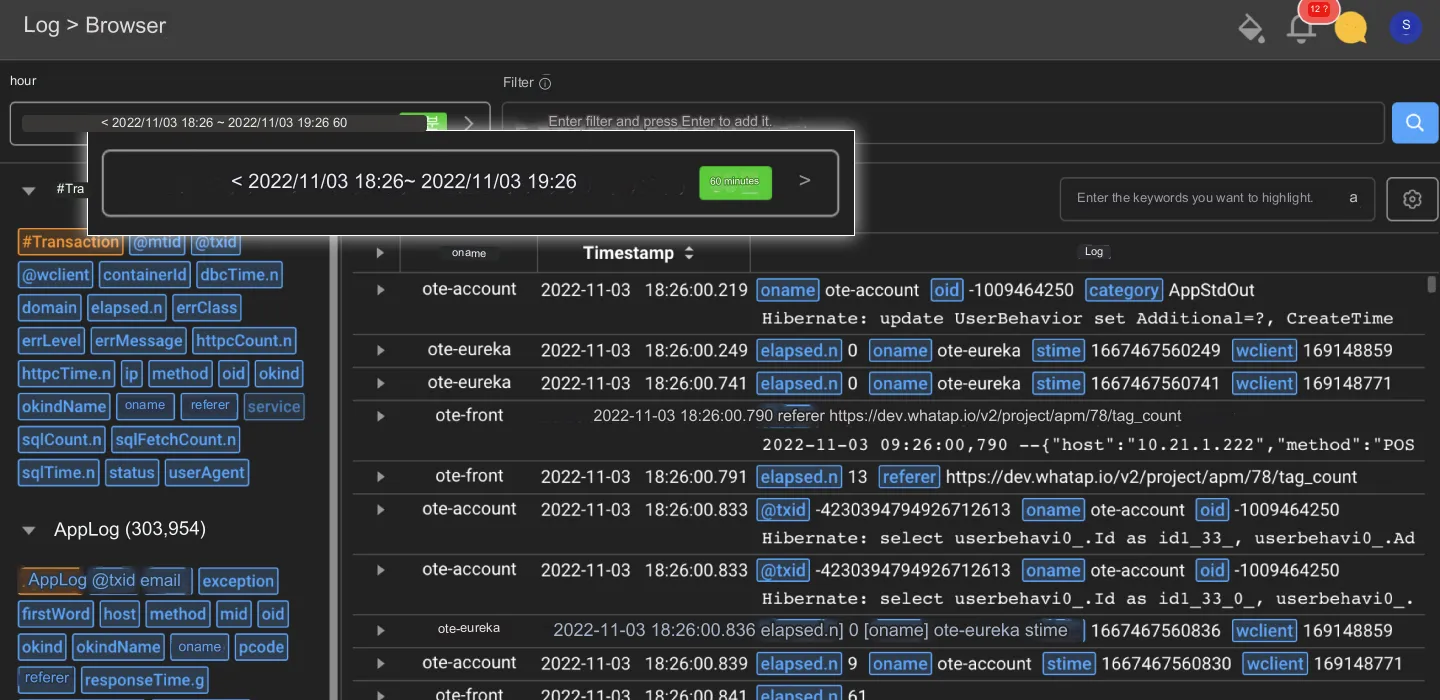
- The Log Parser feature allows you to quickly navigate through large amounts of logs and look up the logs you want.
- Register log events to alert you when you need them so you can prepare for failures.
- You can see log usage at a glance in the log settings
To enable log monitoring, go to the [Project menu] > [Log] > [Settings] menu. Check the settings for each agent, then turn on the enable log monitoring feature.
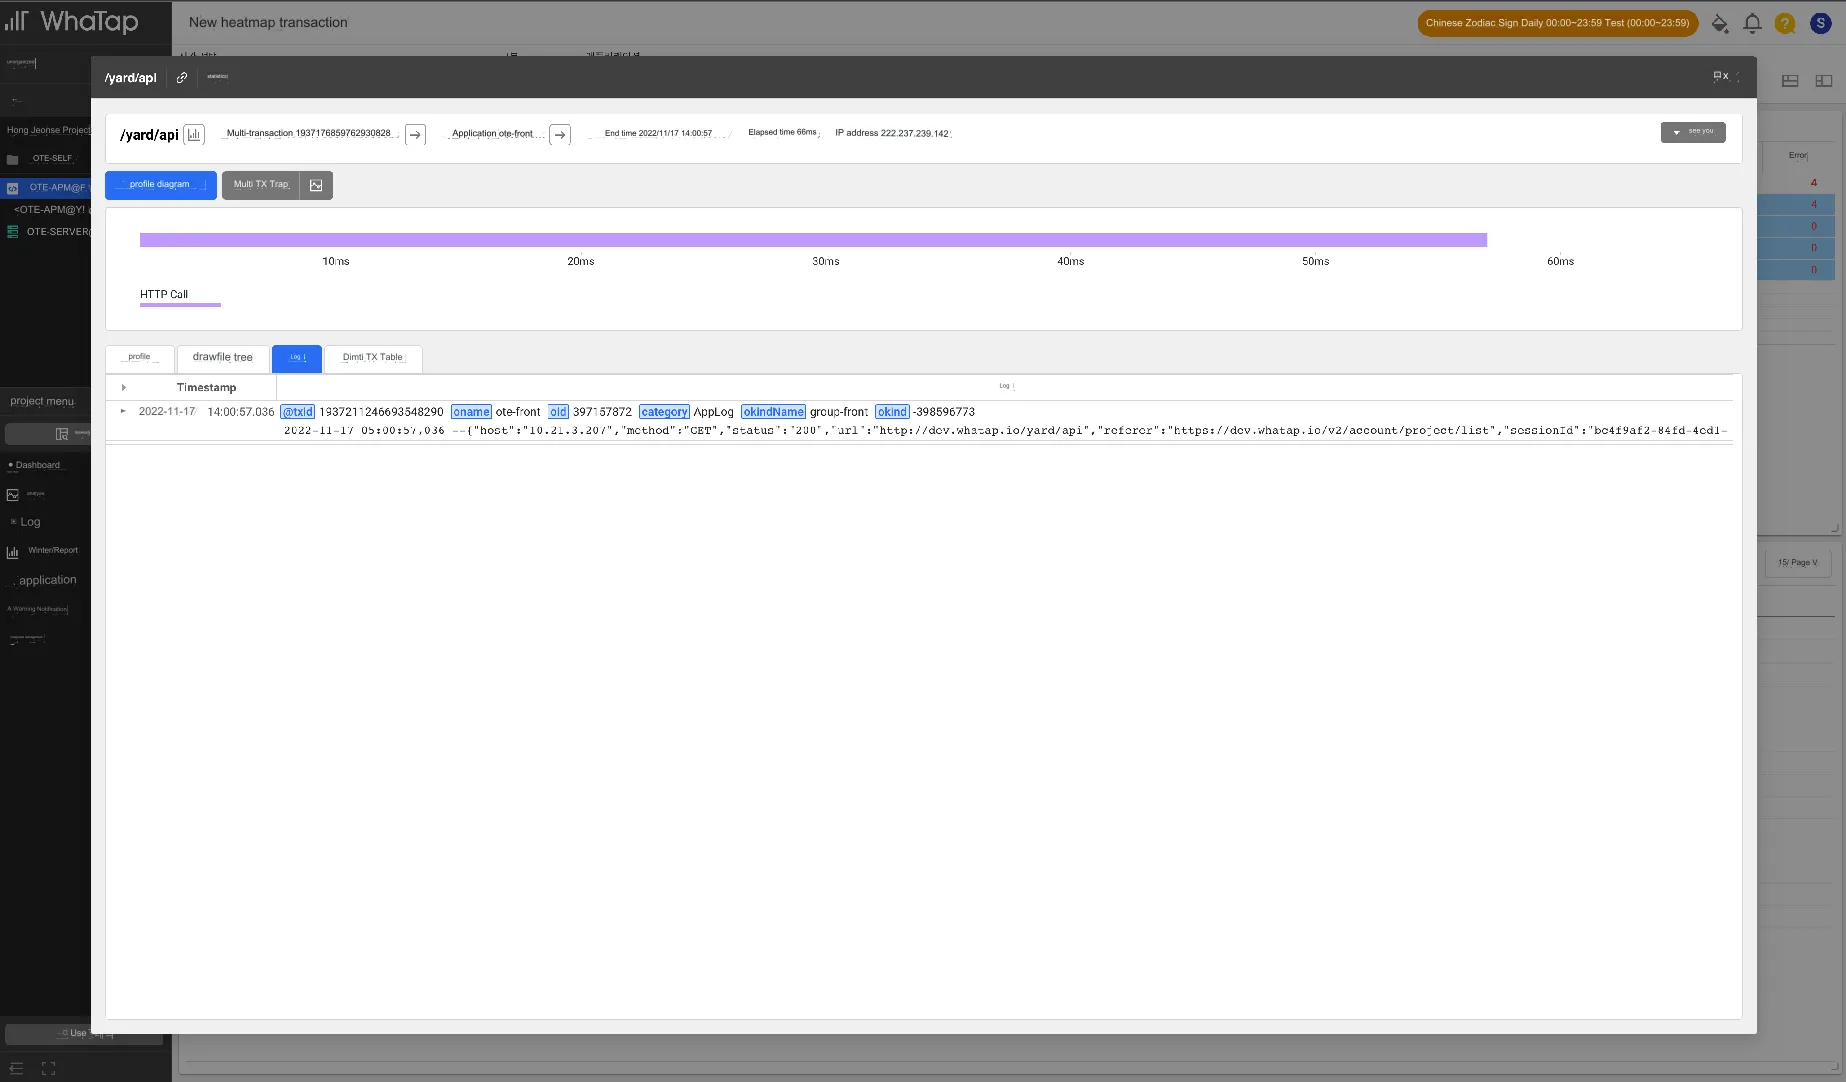
If log monitoring is enabled, you can also view logs by txid on the [Analyze] > [Hitmap] > [Profile detail] tab for Java, Python, and Kubernetes platforms.
Let's take a look at some of the log monitoring features we added.
Log Parser Settings
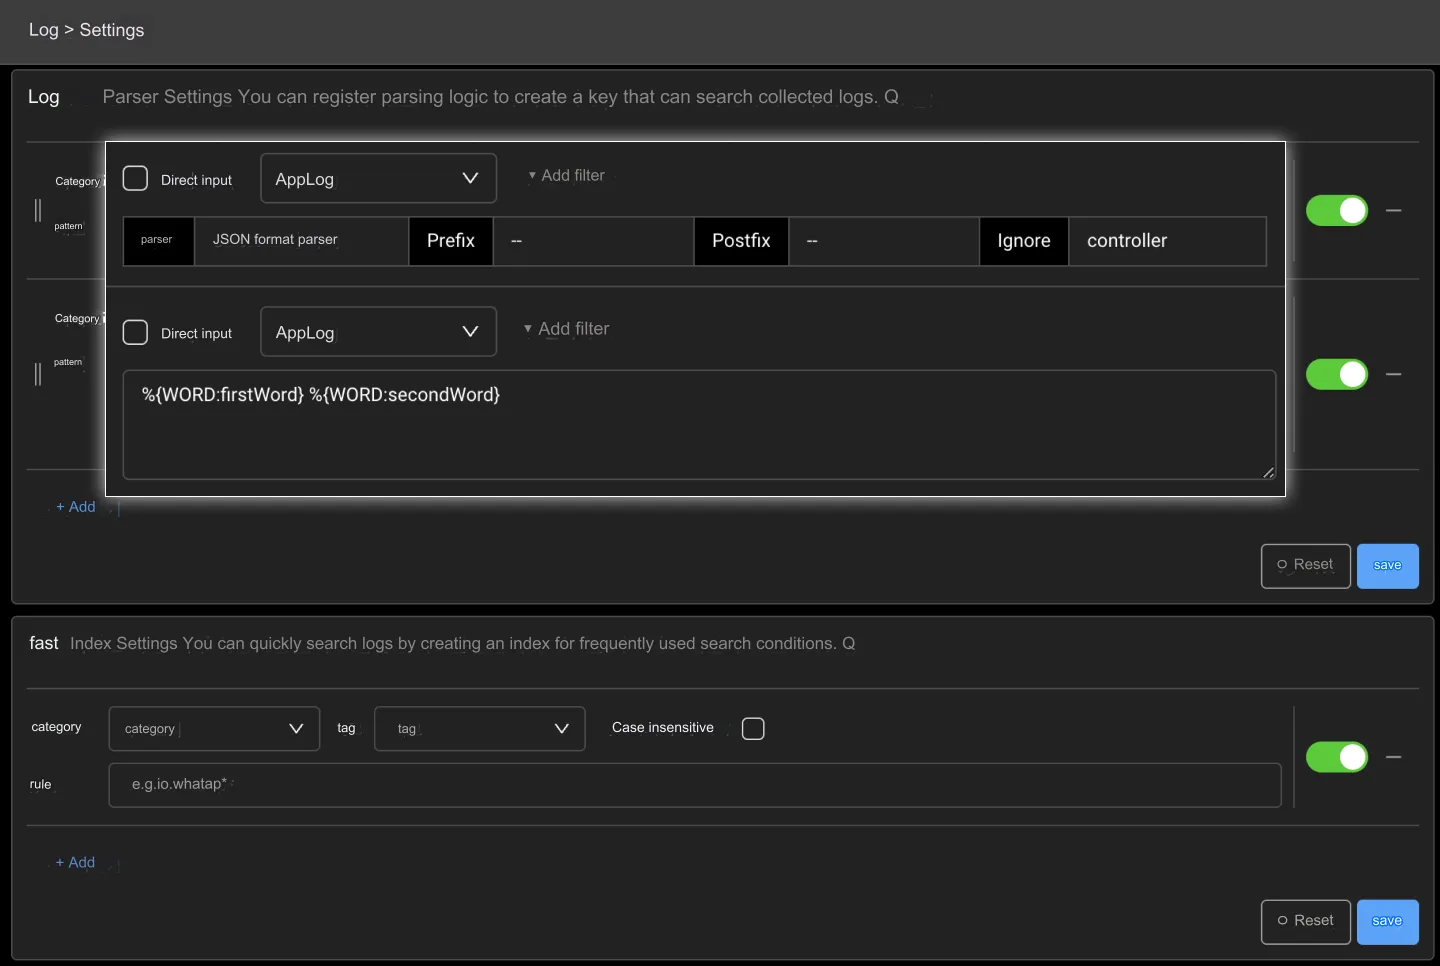
To make good use of log data, it is important to extract keywords from the collected log data and make them into search keys. To efficiently extract key information from logs, WhaTap provides a parsing setting function.
Select a project on the home screen, then go to [Project menu] > [Log] > [Settings] menu. You can register parsing logic by going to the [Log Parser Settings] section. When you register a parsing logic to create a key, the value parsed with that key is added when you look up a log.
You can simulate if parsing will be successful with the pattern you want to register in advance. If the simulation is successful, you can also check the performance by measuring the time taken for repeated parsing.
For more information on setting up a log parser, refer to the WhaTap guide.
Setting up log event alert notifications
If you collect a large amount of logs, log search performance can degrade significantly. You can create an index of frequently used search terms to quickly look up logs.
Select a project on the home screen, then go to the [Project menu] > [Log] > [Settings] menu. Go to the [Quick index settings] section to create your favorite search terms.
For more information on [Quick Index Settings], refer to the WhaTap Guide document.
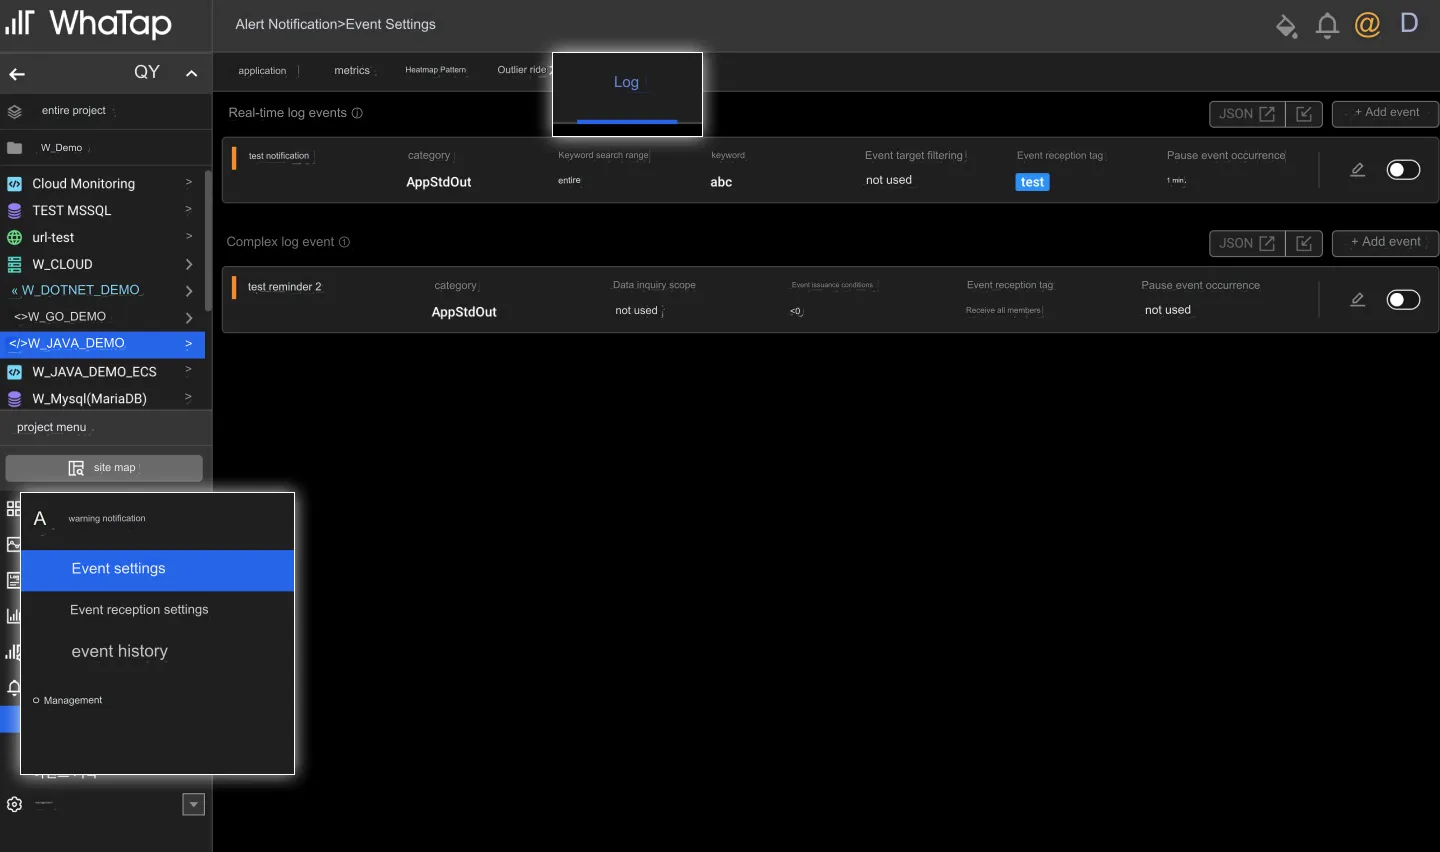
Setting up log event alert notifications
You can set up alert notifications by filtering the collected log data according to conditions. Warning notifications are sent when a keyword occurs in logs collected in real time. You can also send warning notifications when the number of recently collected logs that meet a certain condition is exceeded through settings.
To set up warning notifications for log events, select a project on the home screen, go to the [Project menu] > [Log] > [Settings] menu, and then select the [Log] tab. For more information, refer to the WhaTap guide document.
WhaTap log monitoring is reasonably priced
Please check the pricing plans below before using log monitoring. WhaTap log monitoring is reasonably priced. You can try it for free for 15 days to make a decision, and you can keep the data for up to 40 days.
* Log data is stored for up to 3 days during the free trial period, and data is kept for up to 40 days when paid.
Conclusion
WhaTap's log monitoring feature can help you make better business decisions and reduce your engineers' debugging and outage response time. Try WhaTap Log Monitoring, with its simple setup and reasonable pricing. Get the most value out of your log management and save yourself the trouble. ☺️


