.svg)
.svg)


1. What is Container OOM Killed?
Out of Memory (OOM) Killed refers to a situation where the limit of available memory allocated to some container within a Kubernetes cluster is exceeded, forcing the system to terminate that container.
This can happen when the memory used by a container is too much compared to its quota, or when you set a memory limit that is not enough. When Kubernetes detects an OOM Killed event in a container, it quickly redeploys Pods that perform the same task so that services in the existing container are not interrupted.
Let's take a look at the main reasons why OOM Killed occurs and how to fix it.
2. Top causes of OOM Killed and how to fix them
Top Cause 1. When container allocated memory is insufficient → Check deployment’s requests and limits
apiVersion:apps/v1kind:Deploymentmetadata:name:example-deploymentspec:replicas:1selector:matchLabels:app:example-apptemplate:metadata:labels:app:example-appspec:containers:-name:example-containerimage:your_container_image:latestresources:requests:memory:"100Mi"#메모리요청(request)limits:memory:"120Mi"#메모리제한(limit)
In the example above, when we created the Deployment named example-deployment, we specified '100Mi' as the minimum memory for the container to run on in requests under resources. This will cause the Deployment to be assigned to a node that has '100Mi' free.
Under the resources item, limits is the maximum memory setting that the container deployed above can use. Since we set it to '120Mi', the container cannot exceed it.
If the value set for limits here is insufficient for the actual memory required by the application, an OOM Killed can occur. By monitoring how often OOM Killed occurs and whether the current settings are properly resource allocated, you can dramatically improve resource management in Kubernetes.
Top Cause 2. Where there is a Memory leak → Check for memory leaks
Memory leak in an application is one of the main causes of OOM Killed. Memory leak usually occurs when there is an error in the process of returning memory after using it, causing the memory in use to keep swelling.
This will gradually eat away at it, eventually consuming all of your system resources. If you do not fix memory leaks, your application can constantly request more memory and end up in an OOM Killed state. It is important to find and fix memory leaks with regular monitoring and transaction traces.
Top Cause 3. If you have not set a memory limit for your container → Check all node memory availability
We have shown you how to set a resource quota for a container in Checking requests and limits in Deployment, but what happens if you have not defined the resources entry itself?
apiVersion:apps/v1kind:Deploymentmetadata:name:example-deploymentspec:replicas:1selector:matchLabels:app:example-apptemplate:metadata:labels:app:example-appspec:containers:-name:example-containerimage:your_container_image:latest
This state prevents Kubernetes from enforcing resource and resource limits between containers.
Containers may try to use all available memory on a node. If containers are constantly trying to consume memory, this can lead to a situation that can affect the overall performance of the node. Therefore, it is important to set resource requests and limits for containers appropriately in Kubernetes.
By specifying appropriate values that take into account your memory requirements and the nature of your application, you can increase the predictability of resource usage and avoid issues like OOM Killed.
3. How do I know right away that something is wrong with my Kubernetes environment?
By observing the container map using WhaTap Kubernetes Monitoring, you can get an at-a-glance view of the usage of various resources across your entire cluster. In this example, we wi'll monitor the memory usage of a container.
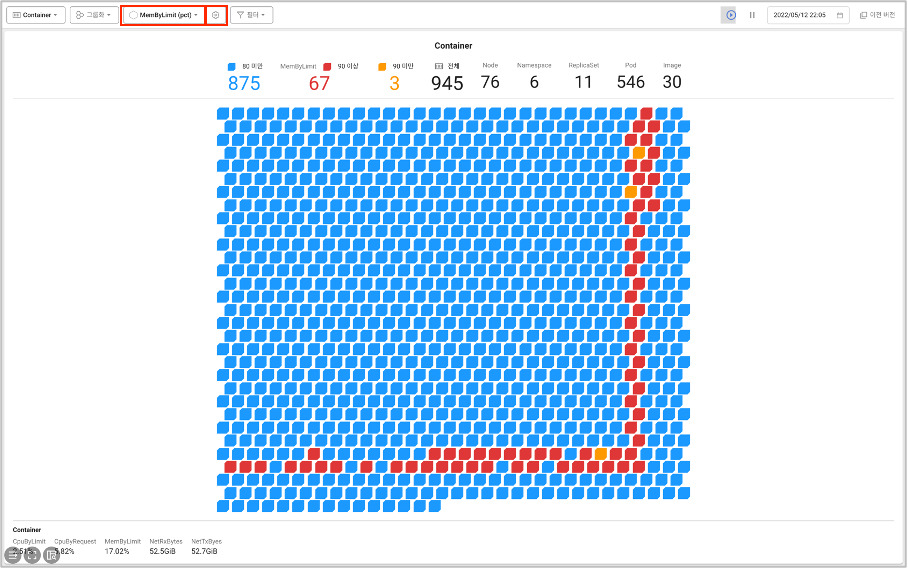
Screen path: [Dashboard] → [Container Map].
Let's select the resources we want to monitor by clicking the two buttons in the container map shown in the image.
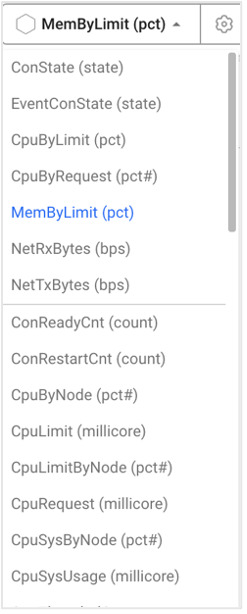
Select a resource from the list.
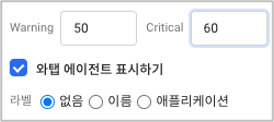
You can specify a threshold (%) of selected resources.
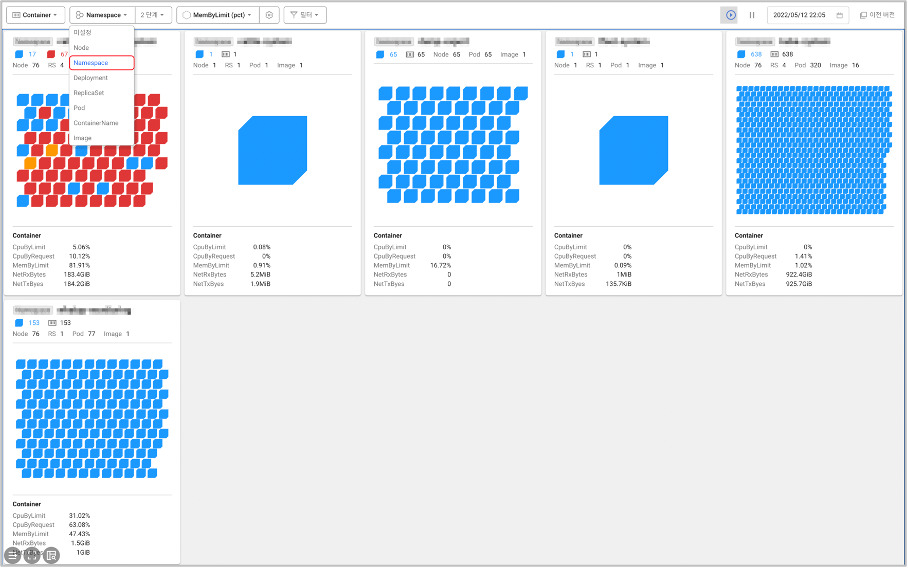
Screen path: [Dashboard] → [Container Map].
From there, you can even group by namespace to get a clear picture of container memory usage on a per-task basis.


