.svg)
.svg)


Database performance management is designed to diagnose problematic databases and help developers and operators tune and apply problematic SQL. With WhaTap Database Monitoring, you can monitor your database's active sessions, SQL being executed, and statistics and details of various metrics in real-time so you can target tuning and see if it works. WhaTap Database Monitoring also allows you to view historical database metrics to help you find and act on issues.
We have revamped WhaTap Database Monitoring to make it more intuitive and easier to troubleshoot. If you have been looking for a database monitoring tool, you will want to take a look at this content. Introducing the revamped WhaTap Database Monitoring screen, a must-have for engineers responsible for database architecture or SQL tuning!
Introducing the new WhaTap Database Monitoring
The instance list view changes depending on the database configuration.
WhaTap Database Monitoring has been reorganized to monitor databases more efficiently than before by changing the instance list view depending on how the database is structured. You can monitor master and slave servers separately, and if the database is organized in a clustered way, you can check it in the same instance view as before.
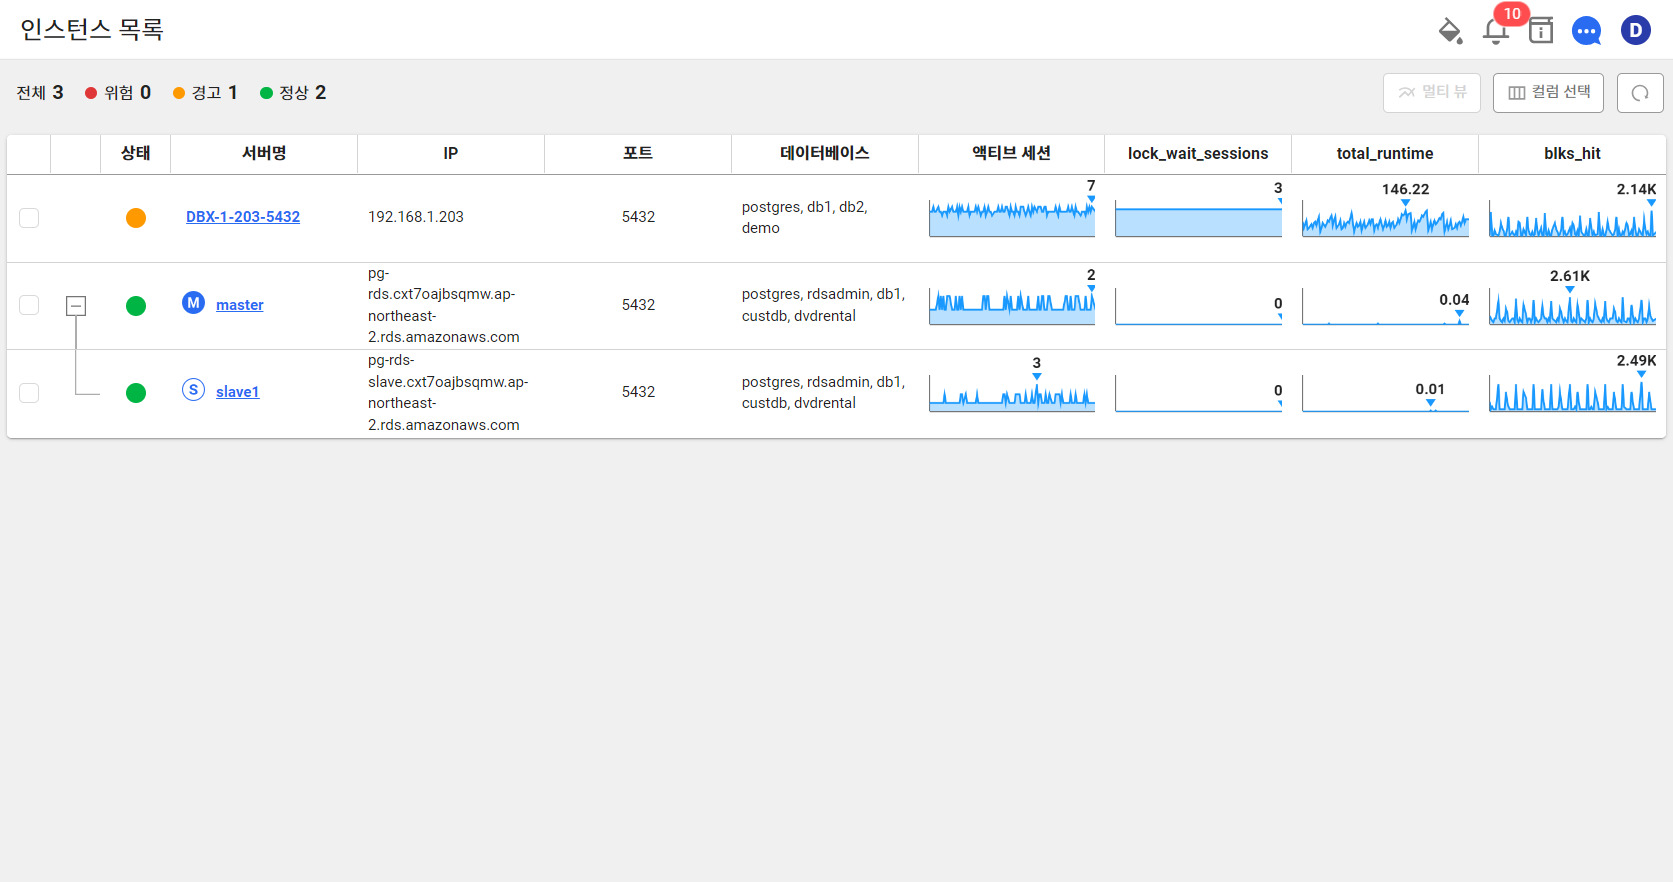
When you have a database with a clustered structure and a database instance with a replication structure together
Easily monitor database logs from your databases in a single tap
If you used to check database logs with the log file viewer, you can now check database logs through the log monitoring menu. The features of WhaTap Log Monitoring can also be utilized for database monitoring, and can be enabled in the log settings. With log monitoring, you can easily see when there is a high volume of logs in an intuitive chart.
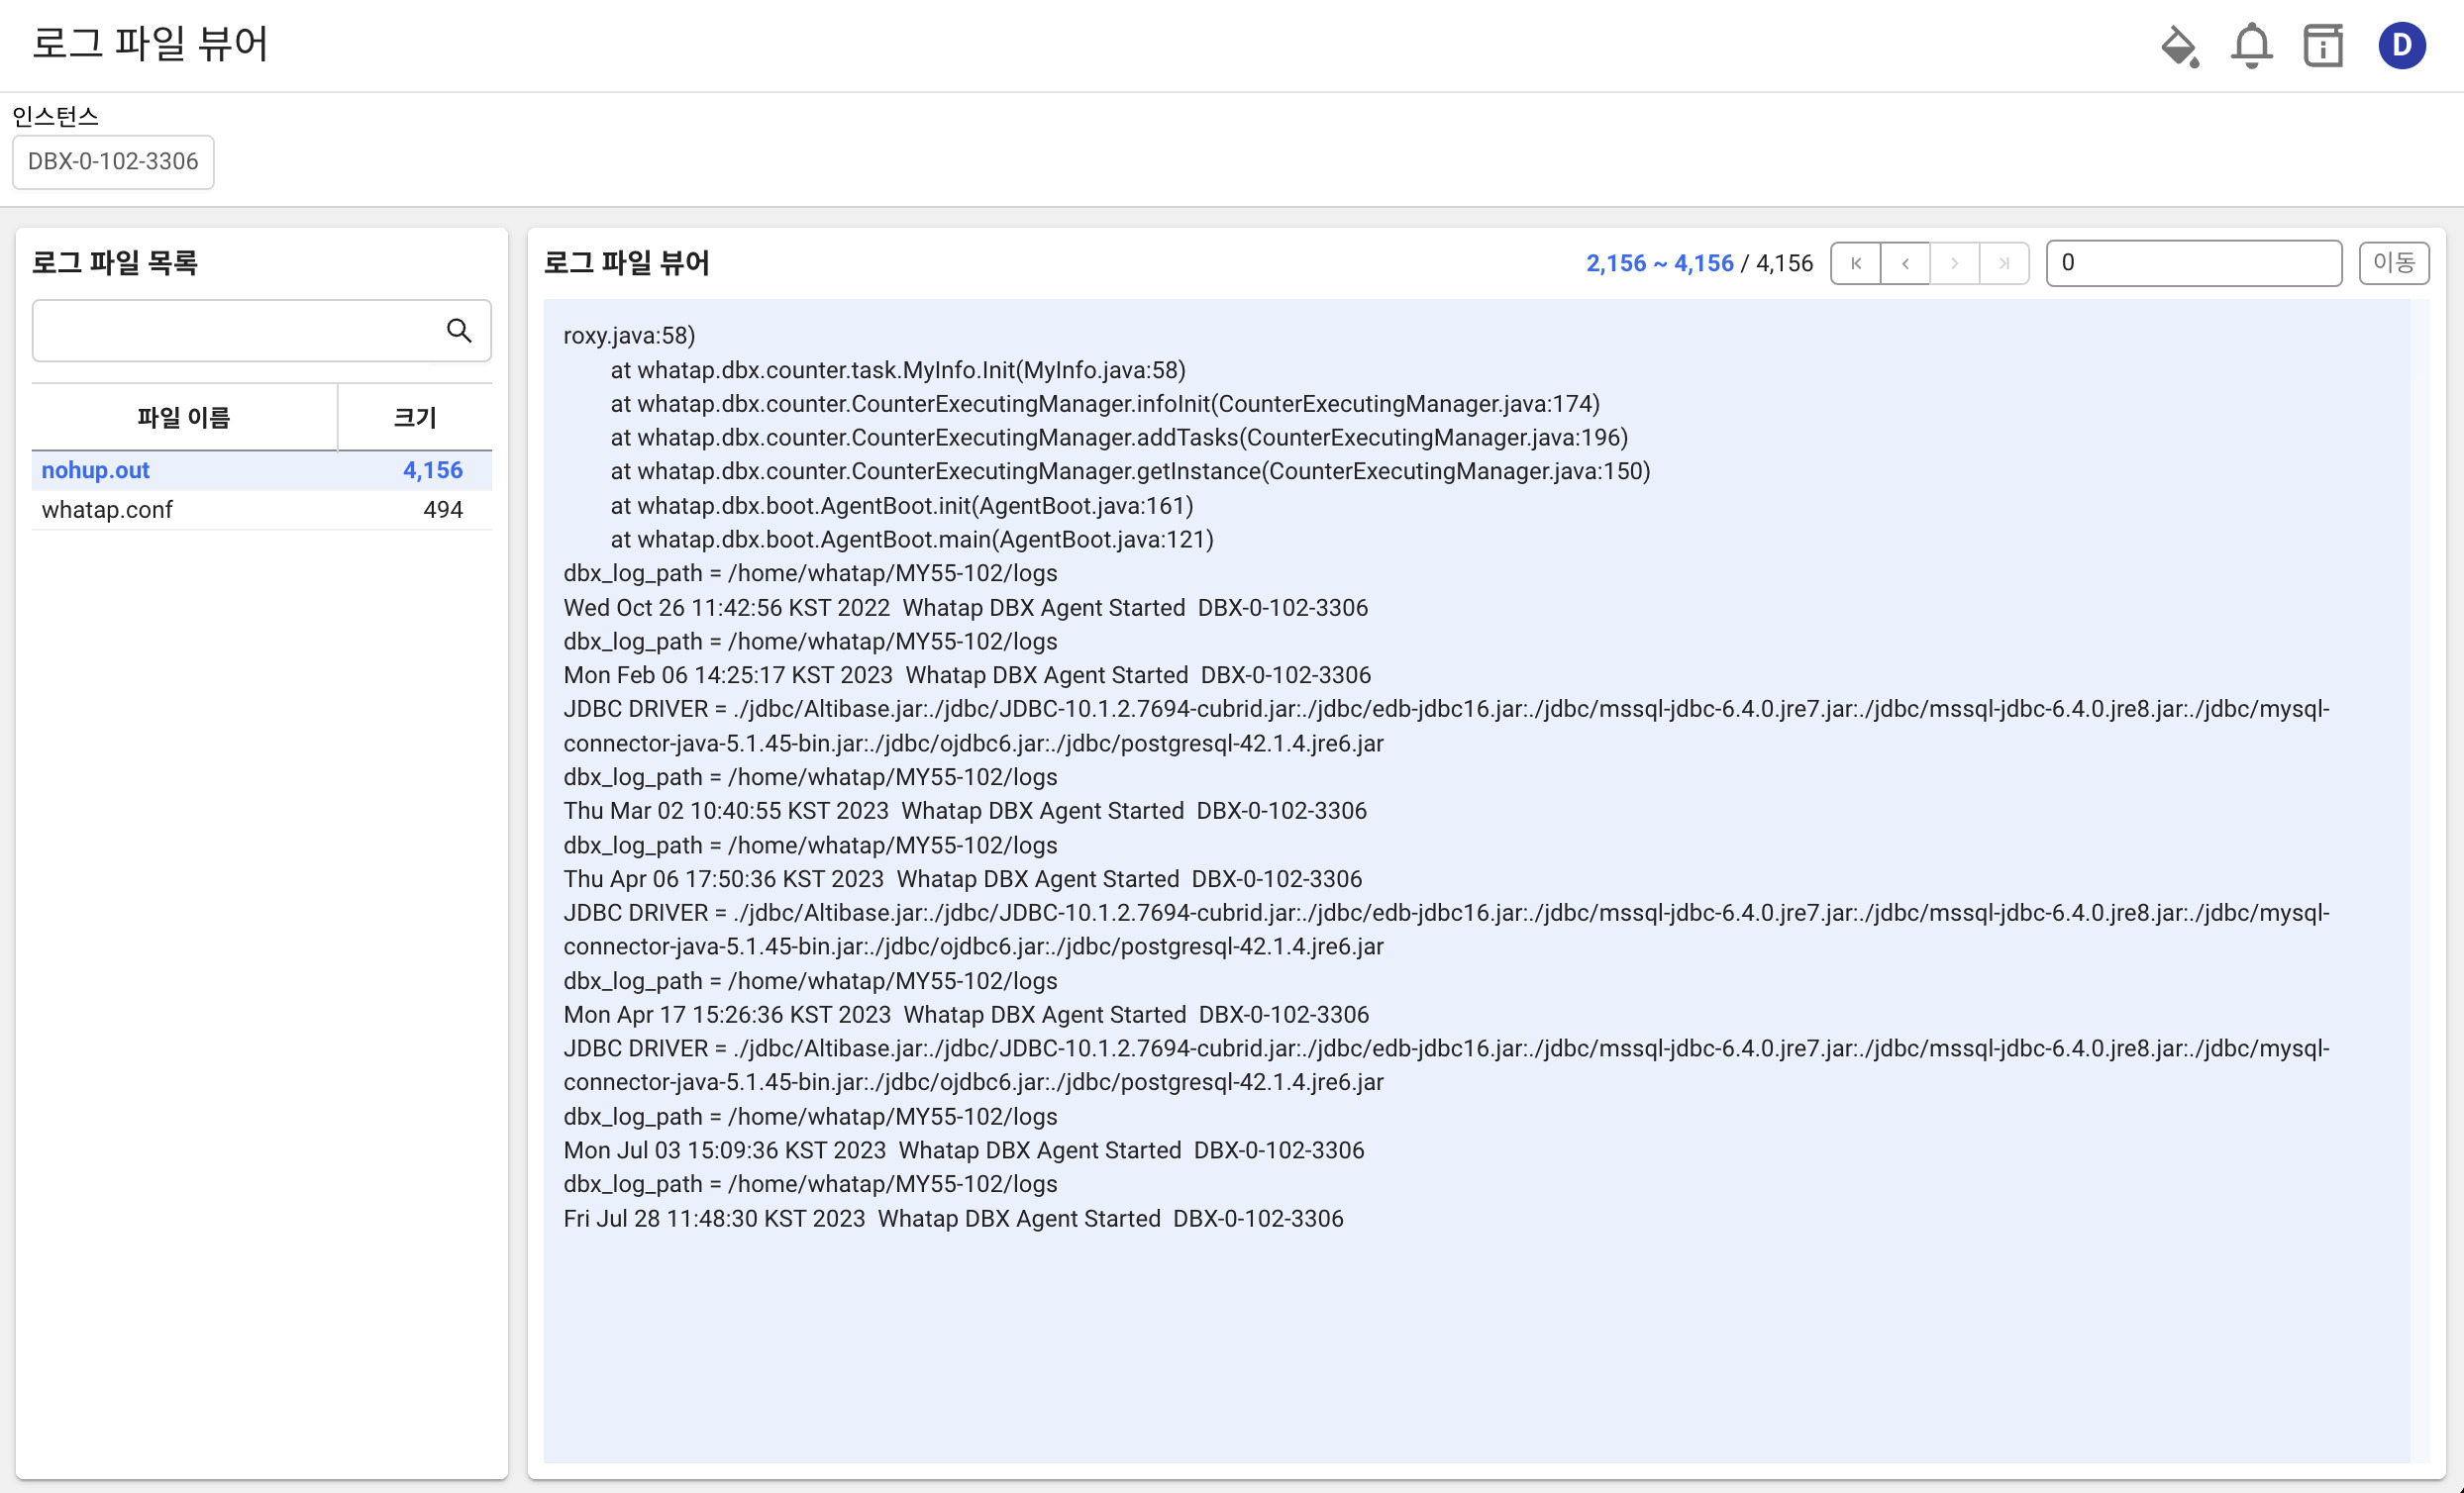
Traditional log file viewer
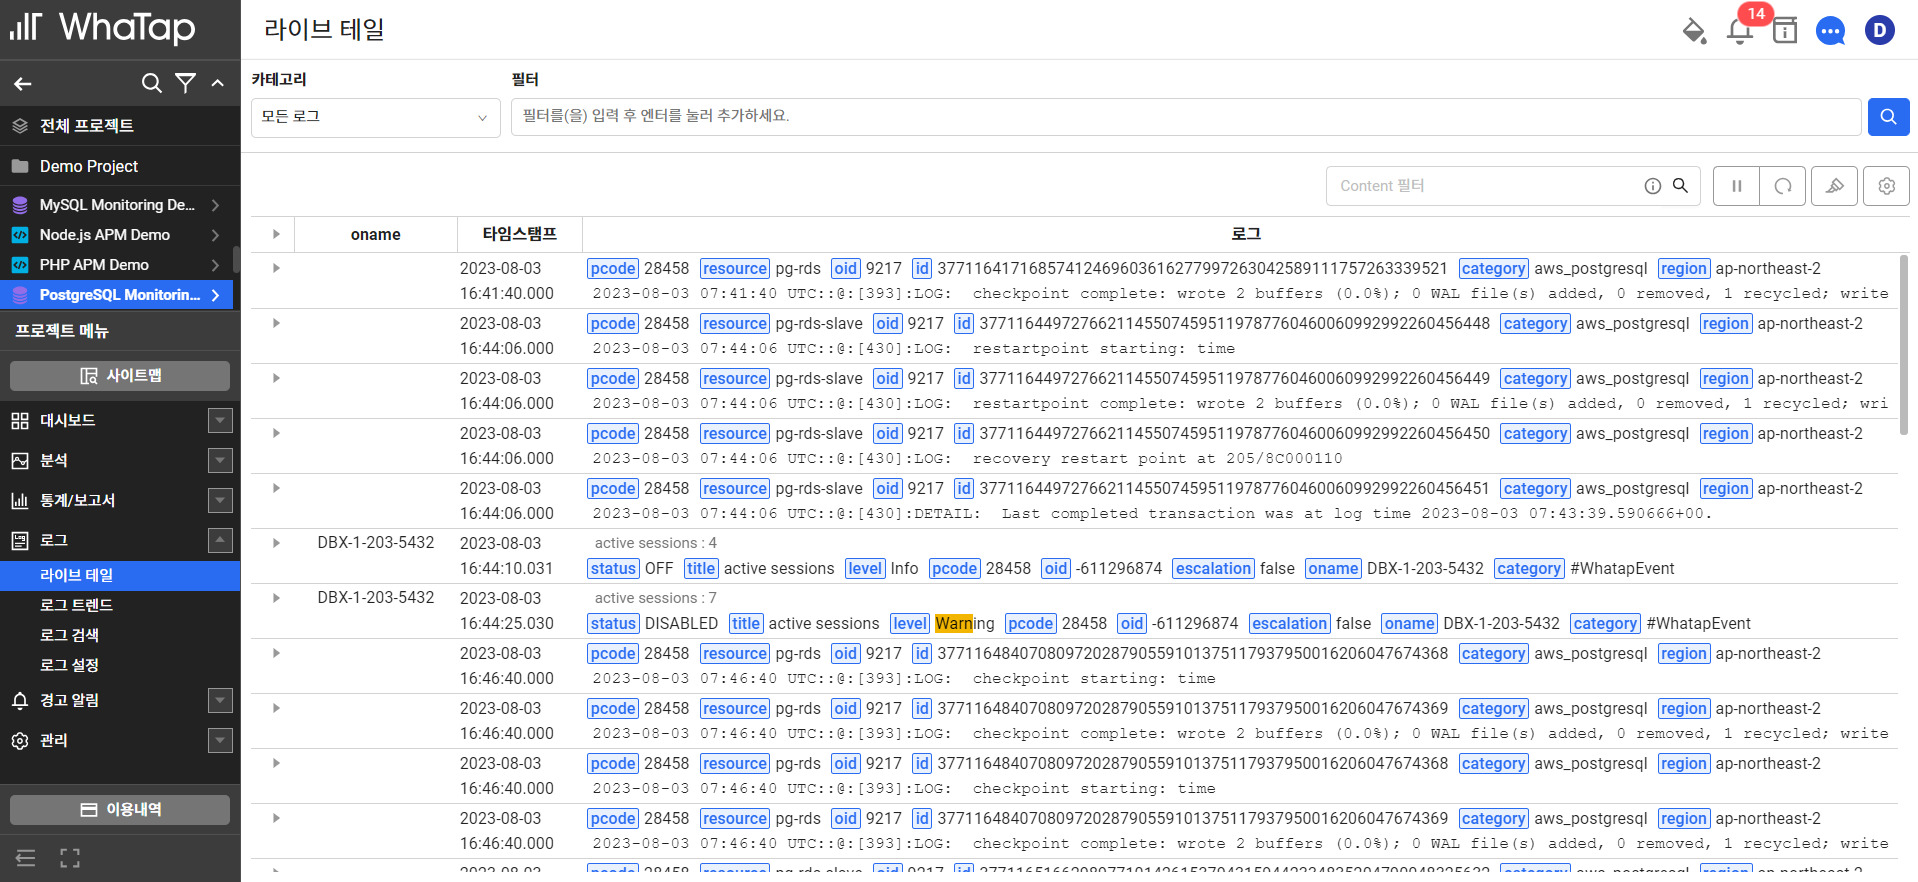
Database log live tail screen example
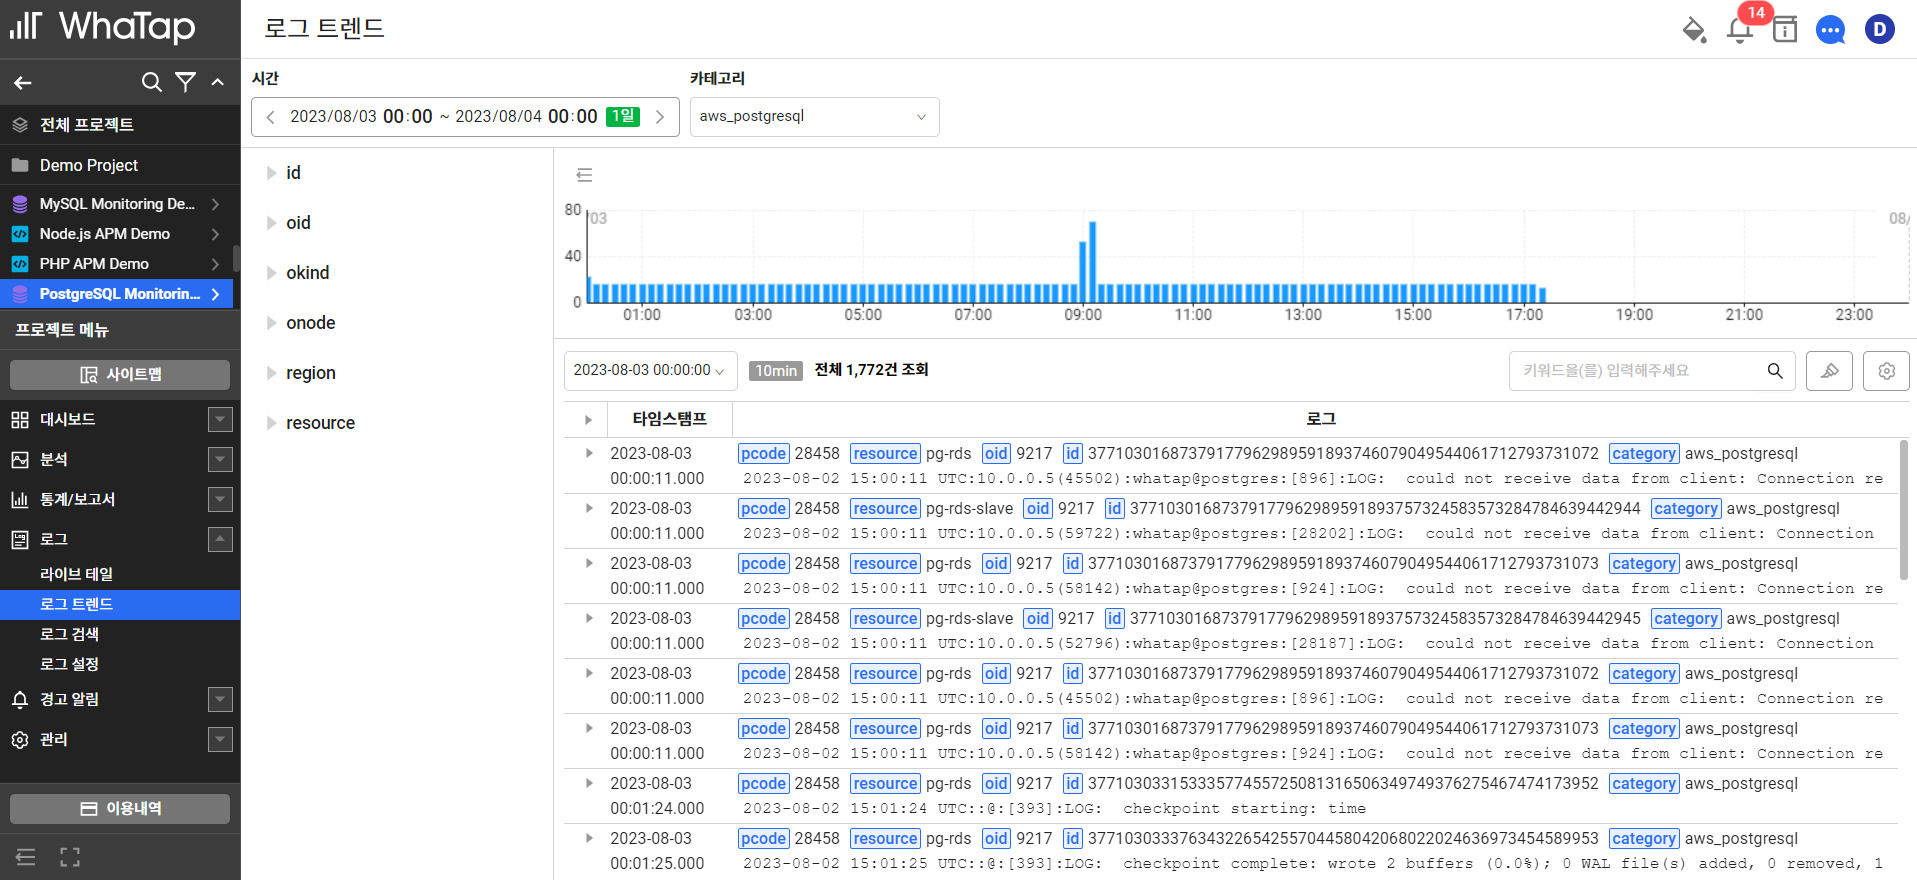
Database log trend examples
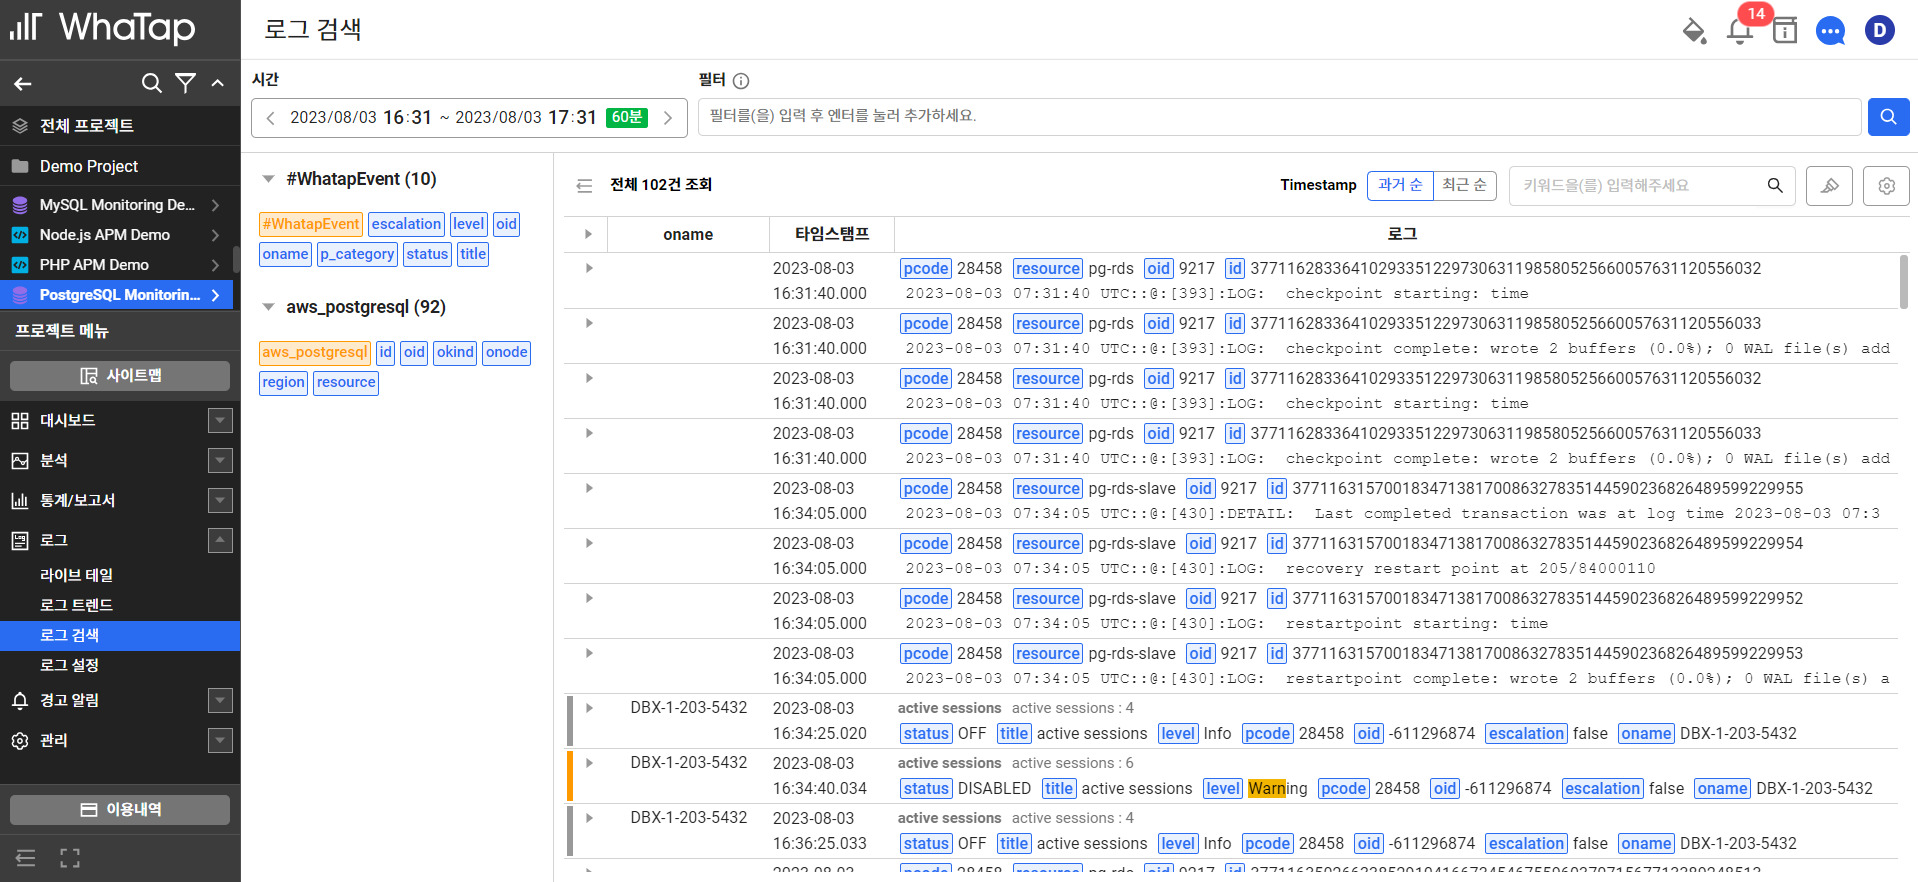
Database log search example
The performance metrics you want to know about are now just a click away!
There are many metrics to look at while monitoring database performance, but now you can quickly and easily see which ones you are interested in with just one click instead of having to hunt for them. We have categorized the recommended metrics by database SQL and improved the dashboard to automatically show users the recommended metrics and make it easier for them.
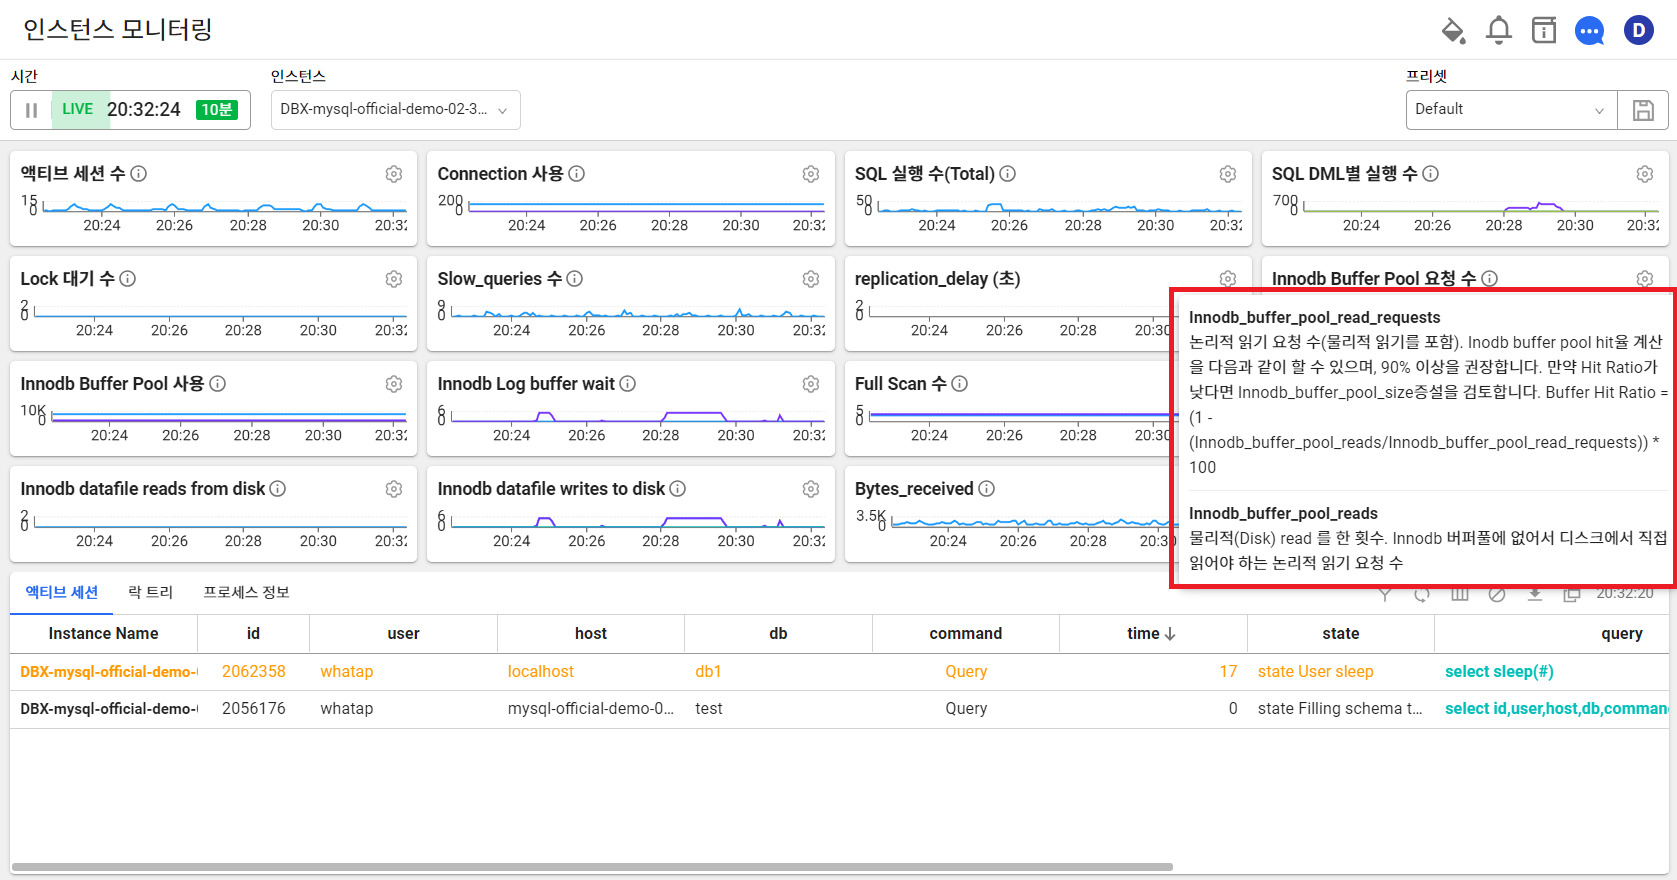
Database Instance Monitoring Tooltip
The UI is now more convenient and intuitive
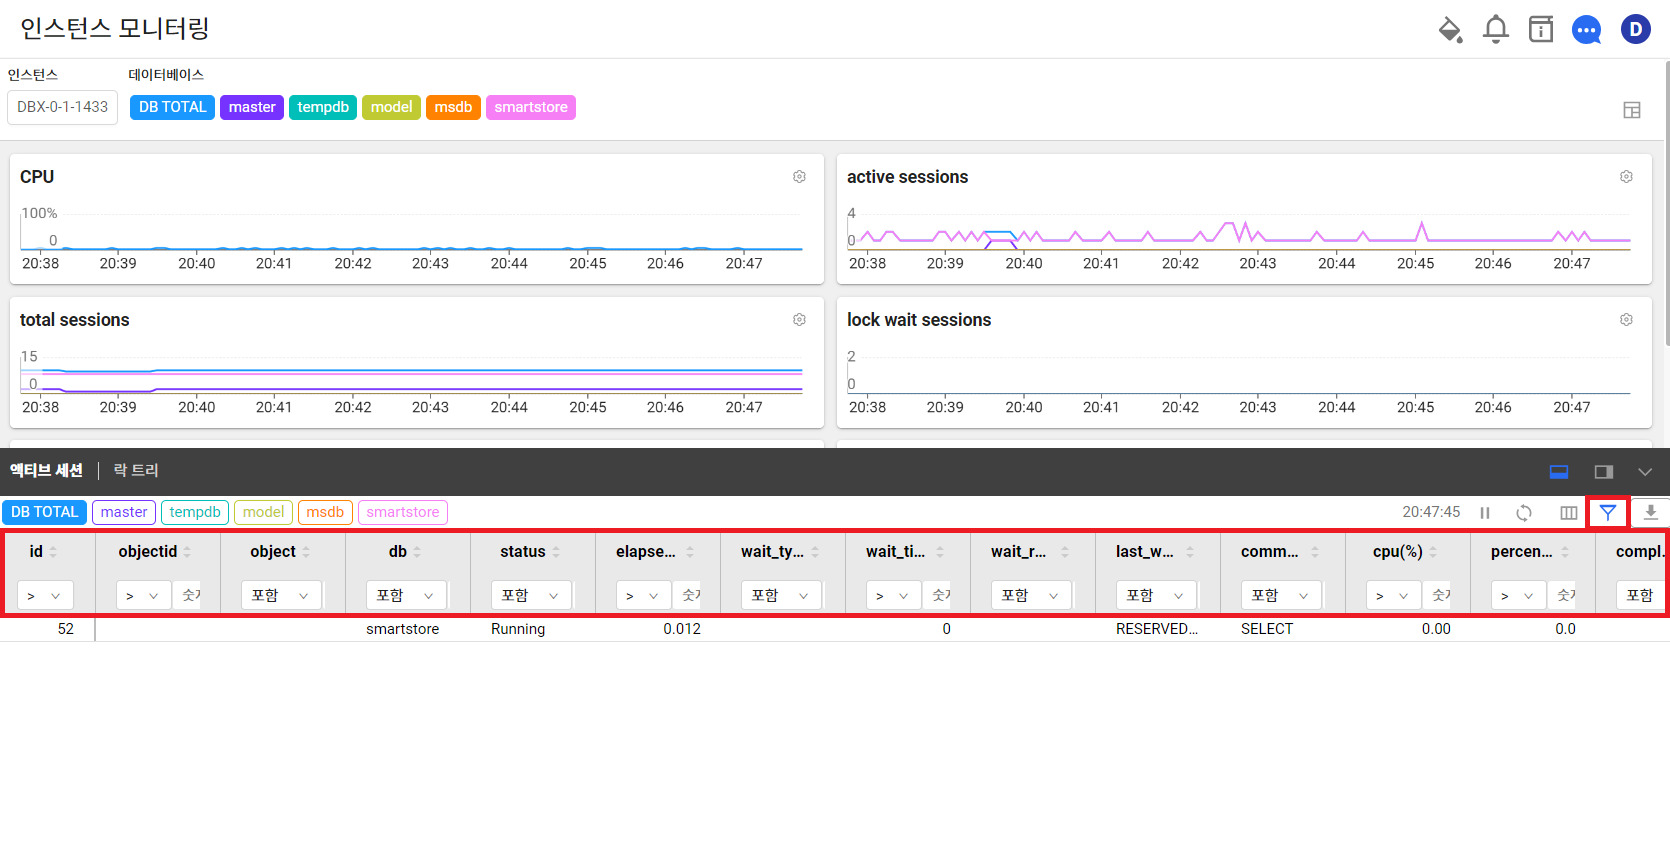
① We have made it easier to apply active session filters in Instance Monitoring. Previously, you had to apply a filter for each active session metric. With the new filter feature, you can now select the filter with the Toogle method to see the metric you want.
Before changing the Active Session Filter UI
After changing the Active Session Filter UI
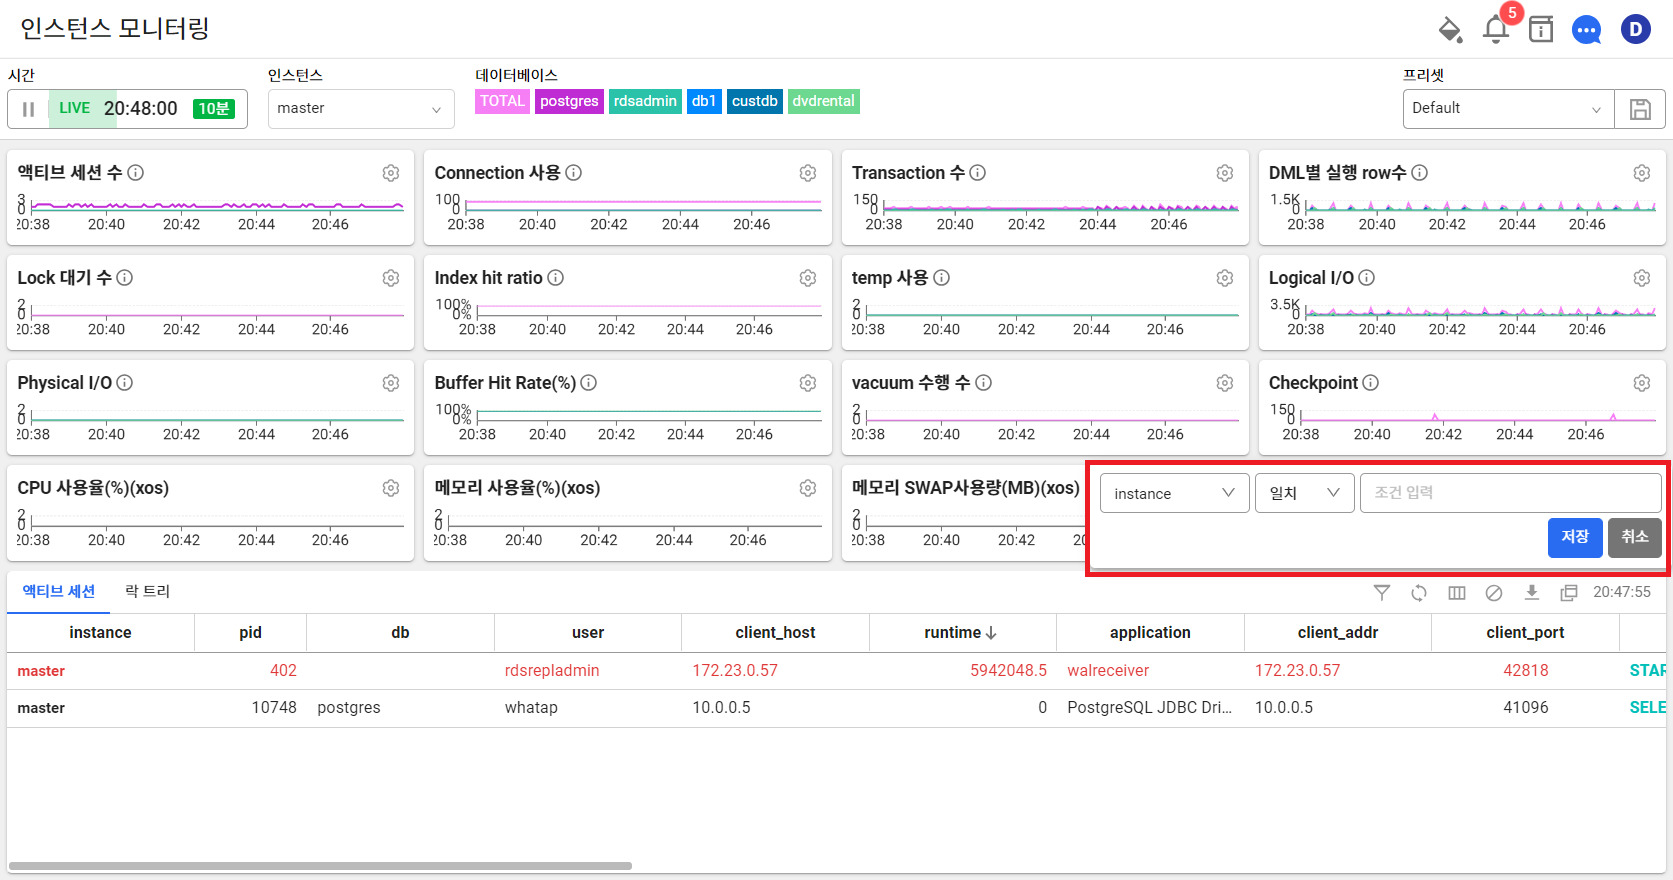
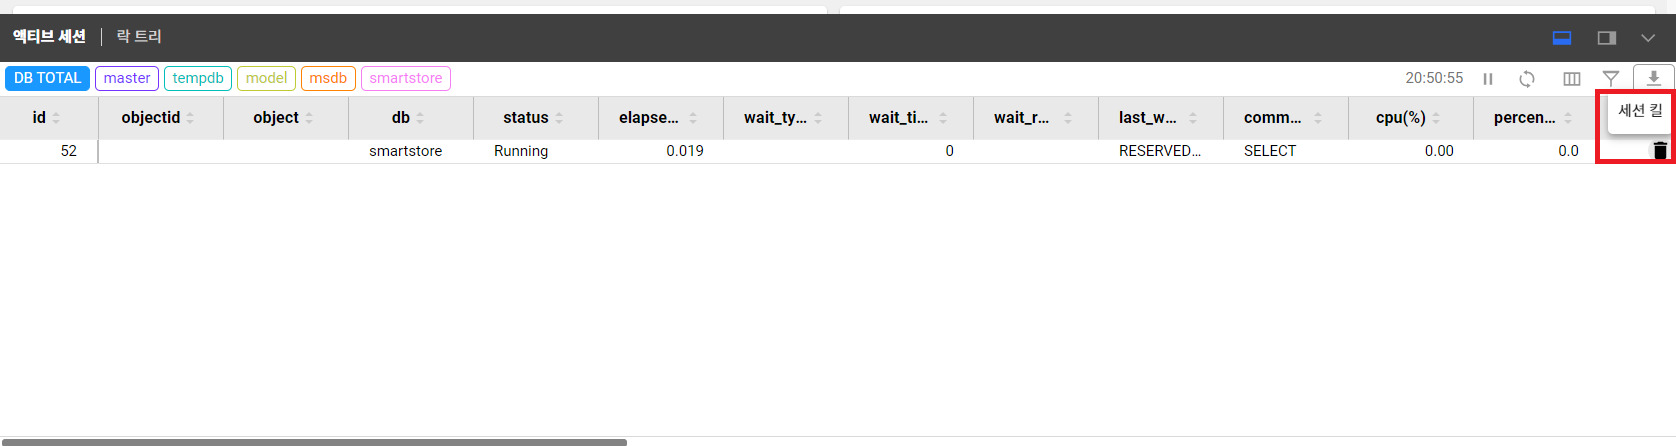
② We have improved the UI to allow you to kill multiple sessions at once
A session in a database is the entire period of time from when you connect to the database, perform a number of operations, and then close the connection.
If something goes wrong with the database and transactions are not performing normally, the database itself can go down. In this case, you can perform a session kill to force a long-stalled session to terminate. In the new look of Database Monitoring, we have improved the UI so that you can kill multiple sessions at once.
Before changing Active Session Filter UI
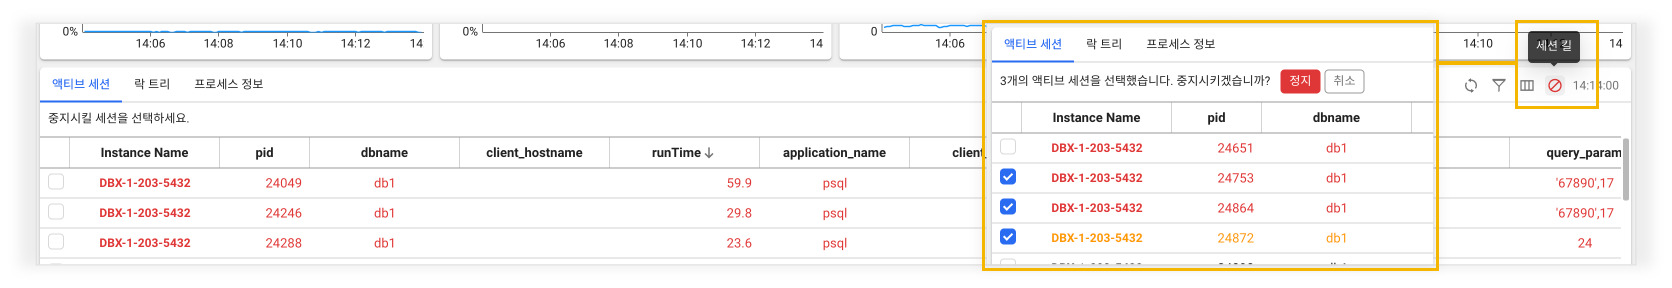
After changing the Active Session Filter UI
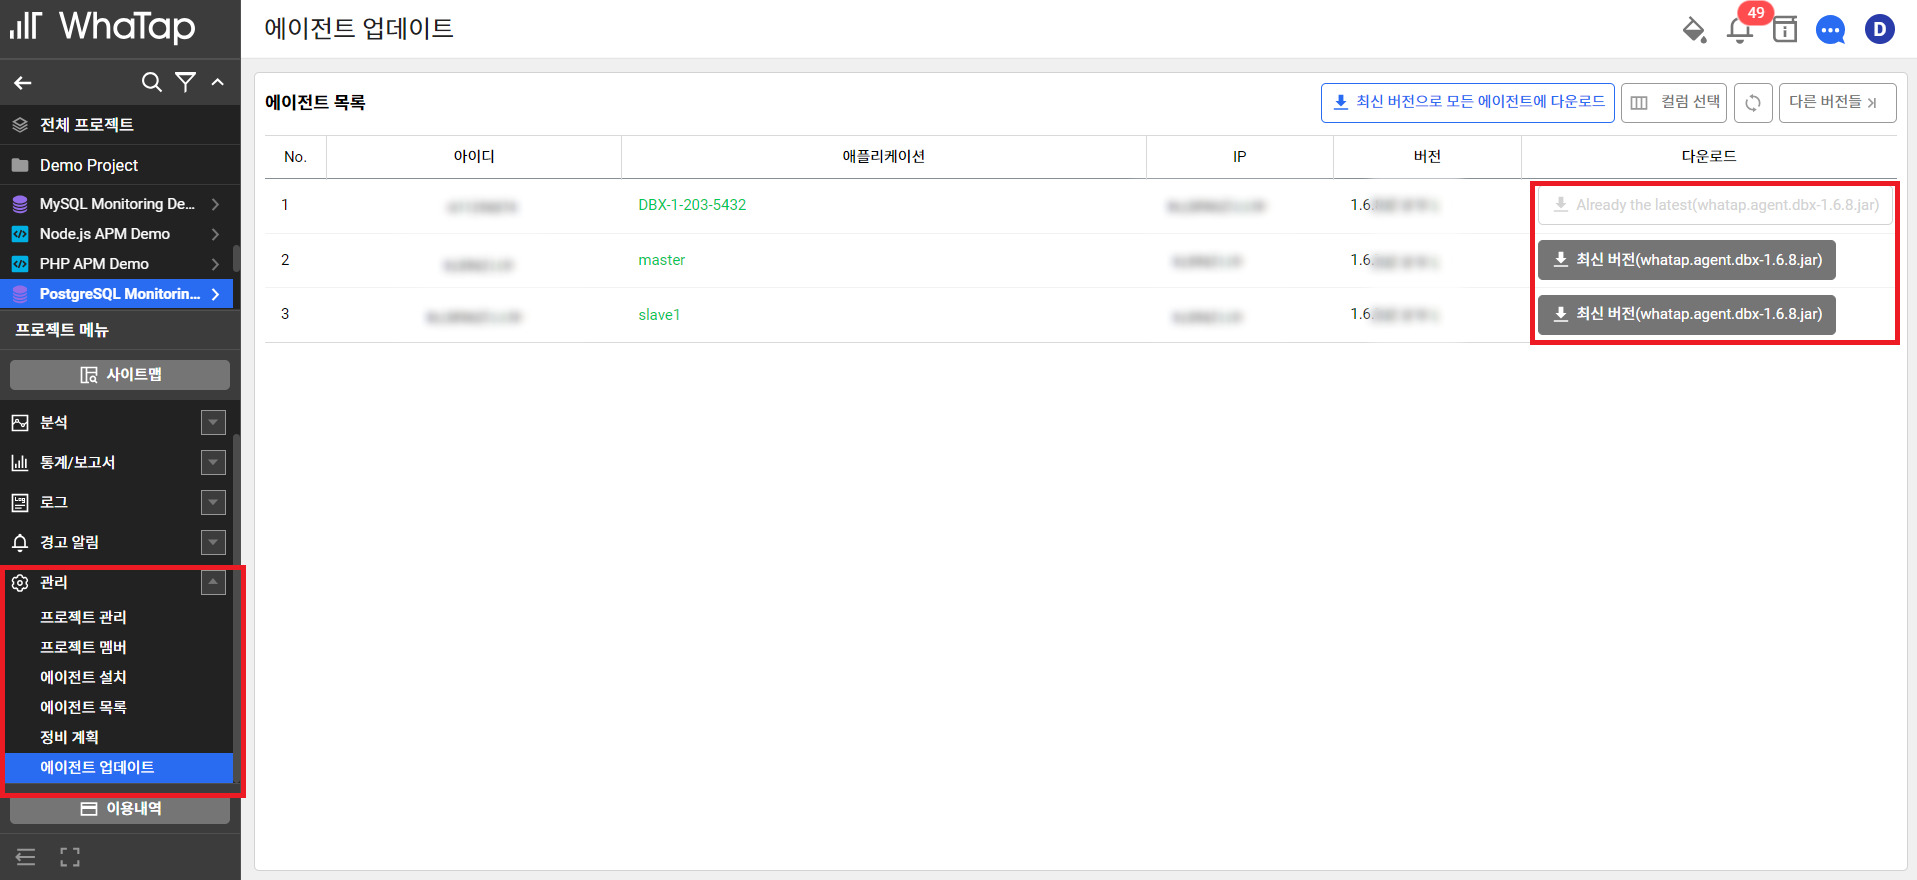
New Database Monitoring, start by checking your agent version
To use the new screens in Database Monitoring, you will need to check the version of the Database Monitoring Agent currently installed.
- PostgreSQL: 1.6.7 or later
- MySQL: 1.6.8 or later
WhaTap is constantly updating features and screens to make it easier and faster for clients to use. We have updated the features from the user's perspective to help you manage your database faster and more effectively, and we will do our best to bring you even better features in the future.


