.svg)
.svg)


Slow page load speeds make users more likely to abandon your page and less likely to convert to sales. To optimize your web pages and improve the user experience, you need to constantly monitor and improve the resources that make up your pages.
Page load analysis can help you identify what factors are slowing down page loads, and help you troubleshoot issues to deliver an optimized user experience. Analyzing your page load will encourage users to use your service or product more and stay longer.
Let's take a look at how WhaTap Browser Monitoring can help you monitor resources to make your web pages faster and more pleasant.
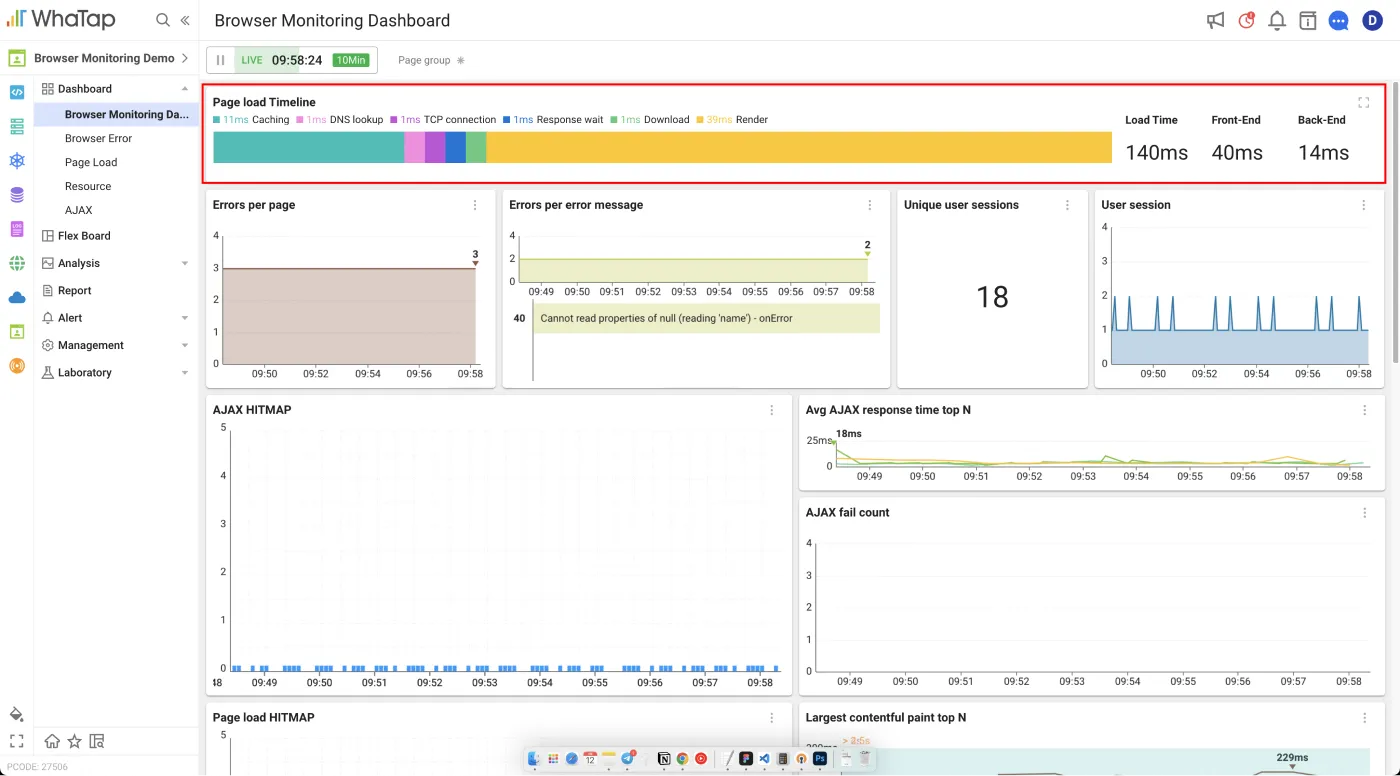
WhaTap Browser Monitoring Dashboard
Next, discover which pages are slow to load. The quickest metrics to look at are Page Load Time and Page Load Count. The Page Load Time and Page Load Count charts can help you discover which pages have high user traffic and long load times.
For example, let's say you are using browser monitoring to discover that a page with a lot of users is taking longer to load. Because that page is important to your business, you can focus on improving its performance.
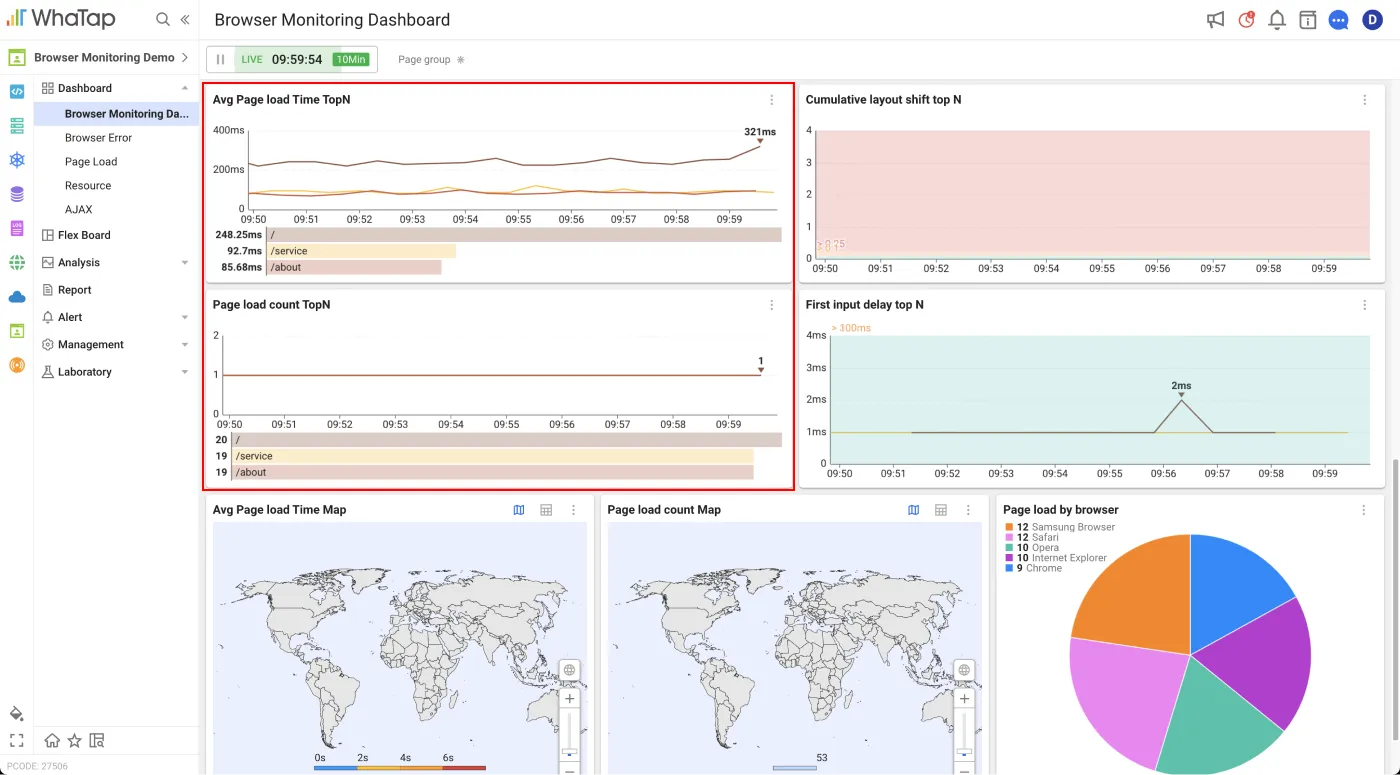
TopN chart of average page load metrics in the WhaTap Browser Monitoring dashboard
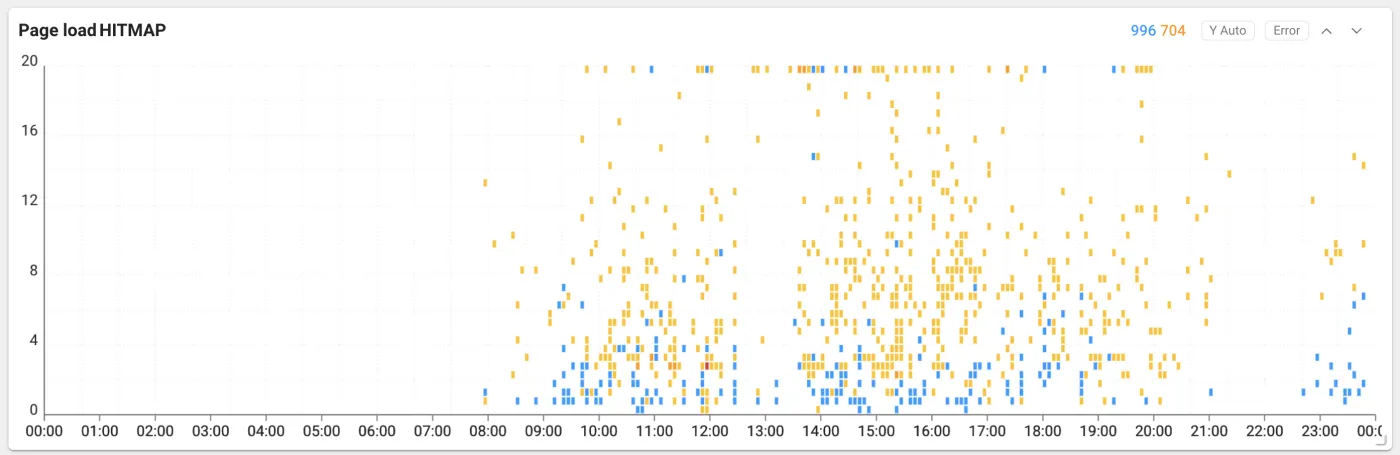
Page load heatmap showing page events in heatmap form
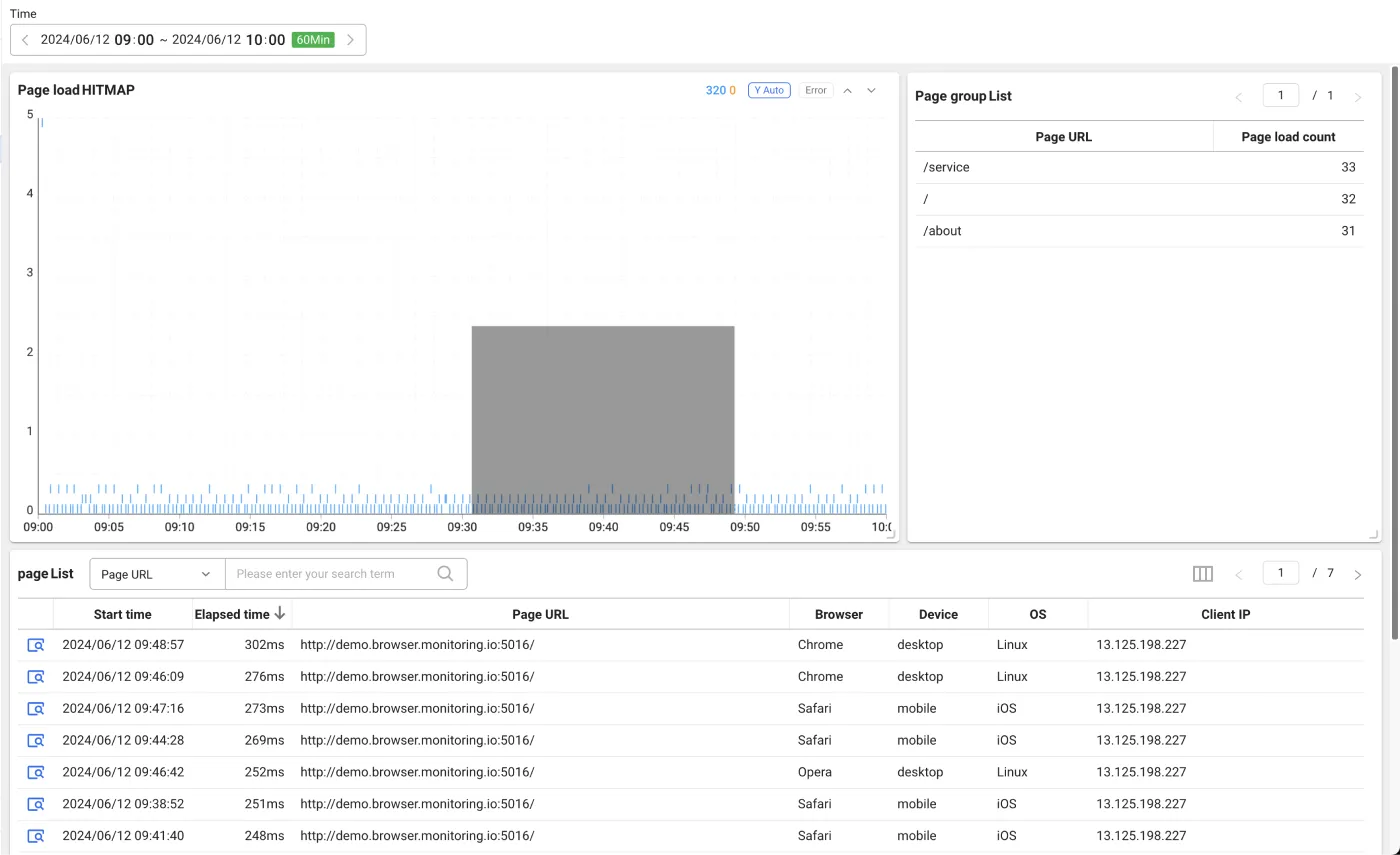
Dragging the Page Load heatmap brings up a list of page events.
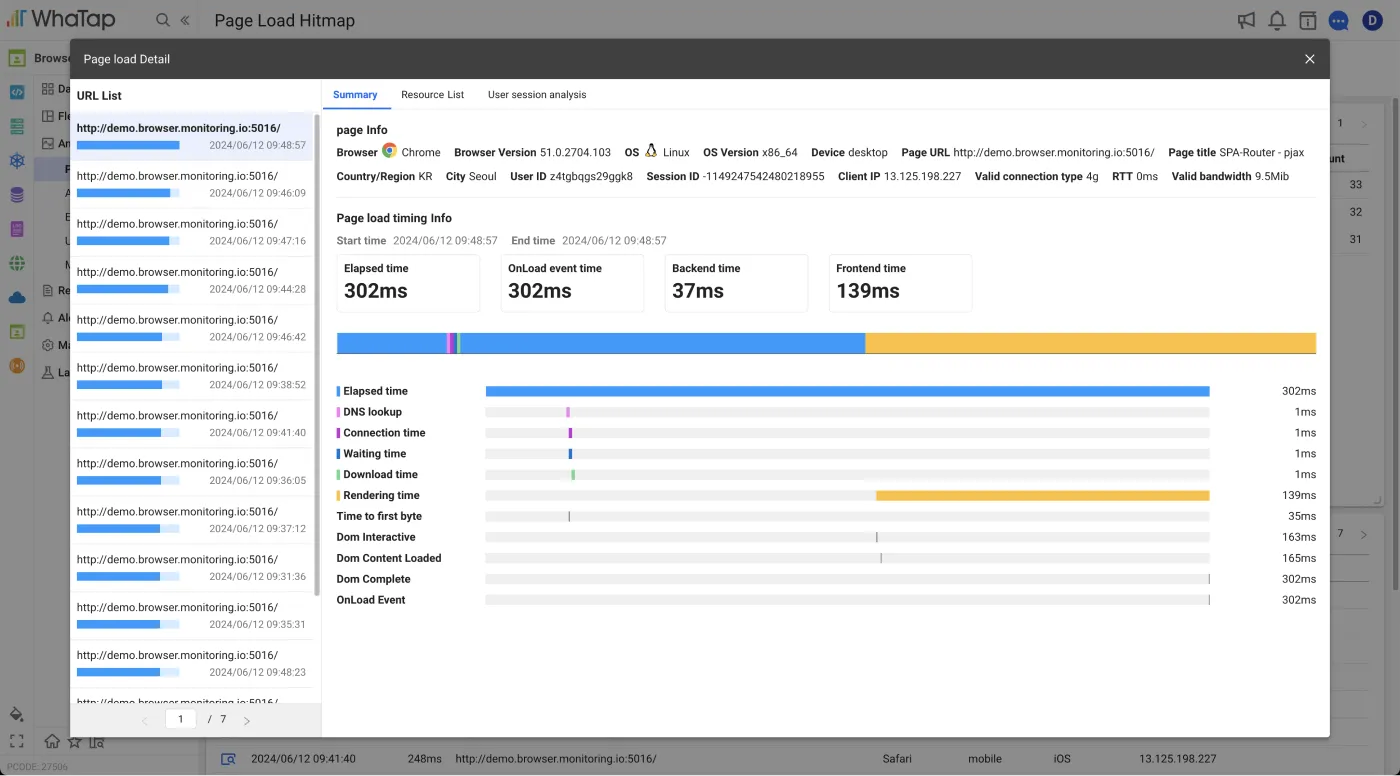
Page load details overview
Provides a graphical chart of the time taken for each section of the page load process. You can use the chart to identify slow sections of the page load process and optimize them.
- Page Info: Provides information about the end user's connection environment, page accessed, user ID, and session ID. You can also use this information to determine anomalies that only occur in certain environments.
Page load timing information shows you how long each section of your page takes to load. The key metrics for sections are as follows.
- Redirect: The average time the browser spent in redirects when loading a web page.
- Caching : The average time the browser spent retrieving cached resources while loading the web page.
- DNS lookup : The average time it took the browser to look up the website domain while loading the web page.
- TCP Connection : The average time the browser spent during the TCP handshake process when loading a web page.
- Response Wait: The average time it took for the browser to receive the first byte from the server after sending a network request to load the web page.
- Rendering: The average time it took to render the resources downloaded from the server to the screen and complete the page load event.
- Load Time: The average time it took the browser to fully load the web page.
- Front-End: The average time it took to initially render the web page.
- Back-End: The average time it took to download the resource from the page load request.
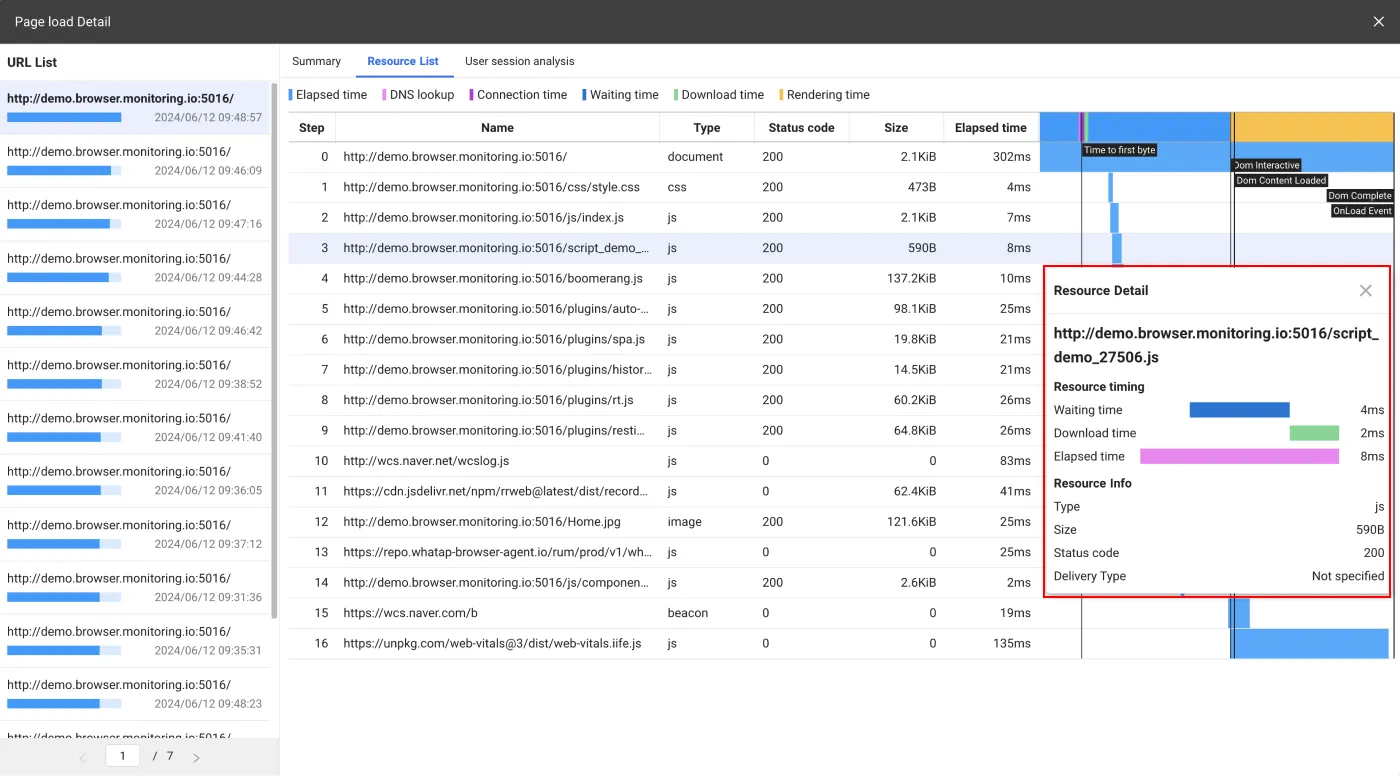
In order to display content on a web page, it needs to download resources from the server. These resources can have a significant impact on page load performance. The Resource list in the Page load details pane gives you a quick view of the loading speed and size of your resources.
It provides a timeline chart based on the start time of the resource, so you can see at a glance which resources are slow to load. The resource list can help you improve resources that are affecting page load. You can view detailed time information in the resource details pane that appears when you select resources.
Finally, we will show you some typical improvements you can make with browser monitoring to improve performance on the front and back end.
Optimizing backend sections
- Optimizing cache settings: Caching can be slow if your web page's cache settings are not optimized or if the cache expiration time is too short. It is important to set appropriate cache expiration times for each type of content.
- Server response time: If your server has slow processing speeds or is overloaded, then response times might be slow. You might need to take steps to optimize server performance or increase server capacity.
- Server location: Long distances between your server and your users can result in high latency. To address this, use a service like a Content Delivery Network (CDN) to ensure that your content is served from a location close to your users.
- Network latency: Slow or unstable internet connections can affect the loading speed of backend sections. This issue may vary depending on your network conditions.
- File size: You might experience slower speeds when downloading large files. Reduce file size by optimizing and compressing resources such as images, scripts, and style sheets.
Optimizing front-end sections
- Heavy CSS: If you use a large number of CSS rules and complex selectors, browsers can spend a lot of time computing styles. Optimize your CSS, simplify rules, and remove unnecessary styles to improve rendering speed.
- Optimizing images: Heavy image files can slow down rendering speeds. Compress images and optimize them to the appropriate size and format. Use page loading techniques as needed to improve rendering speed.
- Using web fonts: Web fonts can provide users with a variety of font styles, but they can affect loading times. Optimize your web fonts and use only what you need. You can also improve rendering speed by displaying text before loading fonts.
In this article, we have shared how to use browser monitoring to see what factors are affecting page load. We hope that browser monitoring has helped you optimize your performance so that you do not lose clients who land on your page, and that it helps you grow your sales and business!


