.svg)
.svg)


Introduction
Database performance management is the process of monitoring the performance of a database in real time, diagnosing and analyzing issues, tuning and applying problematic SQL, and monitoring the performance of the database in real time to ensure that the issues are resolved. Let's take a look at what metrics you should be checking in your database for this process.
1. About infrastructure resources
Every action you perform on your database affects the resources associated with it. Infrastructure resource metrics can help you identify current and potential performance issues. Analyzing resource metrics over a long period of time provides a basis for capacity planning.
- Percentage of CPU time used by database processes
- Available memory
- Available disk space
- Disk queues for queued I/O
- Percentage of virtual memory utilization
- Network bandwidth for inbound and outbound traffic
2. Availability
You need to make sure that the database is available and accessible. To verify the availability of the database, check the following information.
- Verify database accessibility using common protocols such as Ping or Telnet
- Accessibility of database endpoints and ports (e.g. 3306 for MySQL, 5432 for PostgreSQL, etc.)
- Failover events for the master node or upgrade events for Slave/Peer nodes in a multi-node cluster
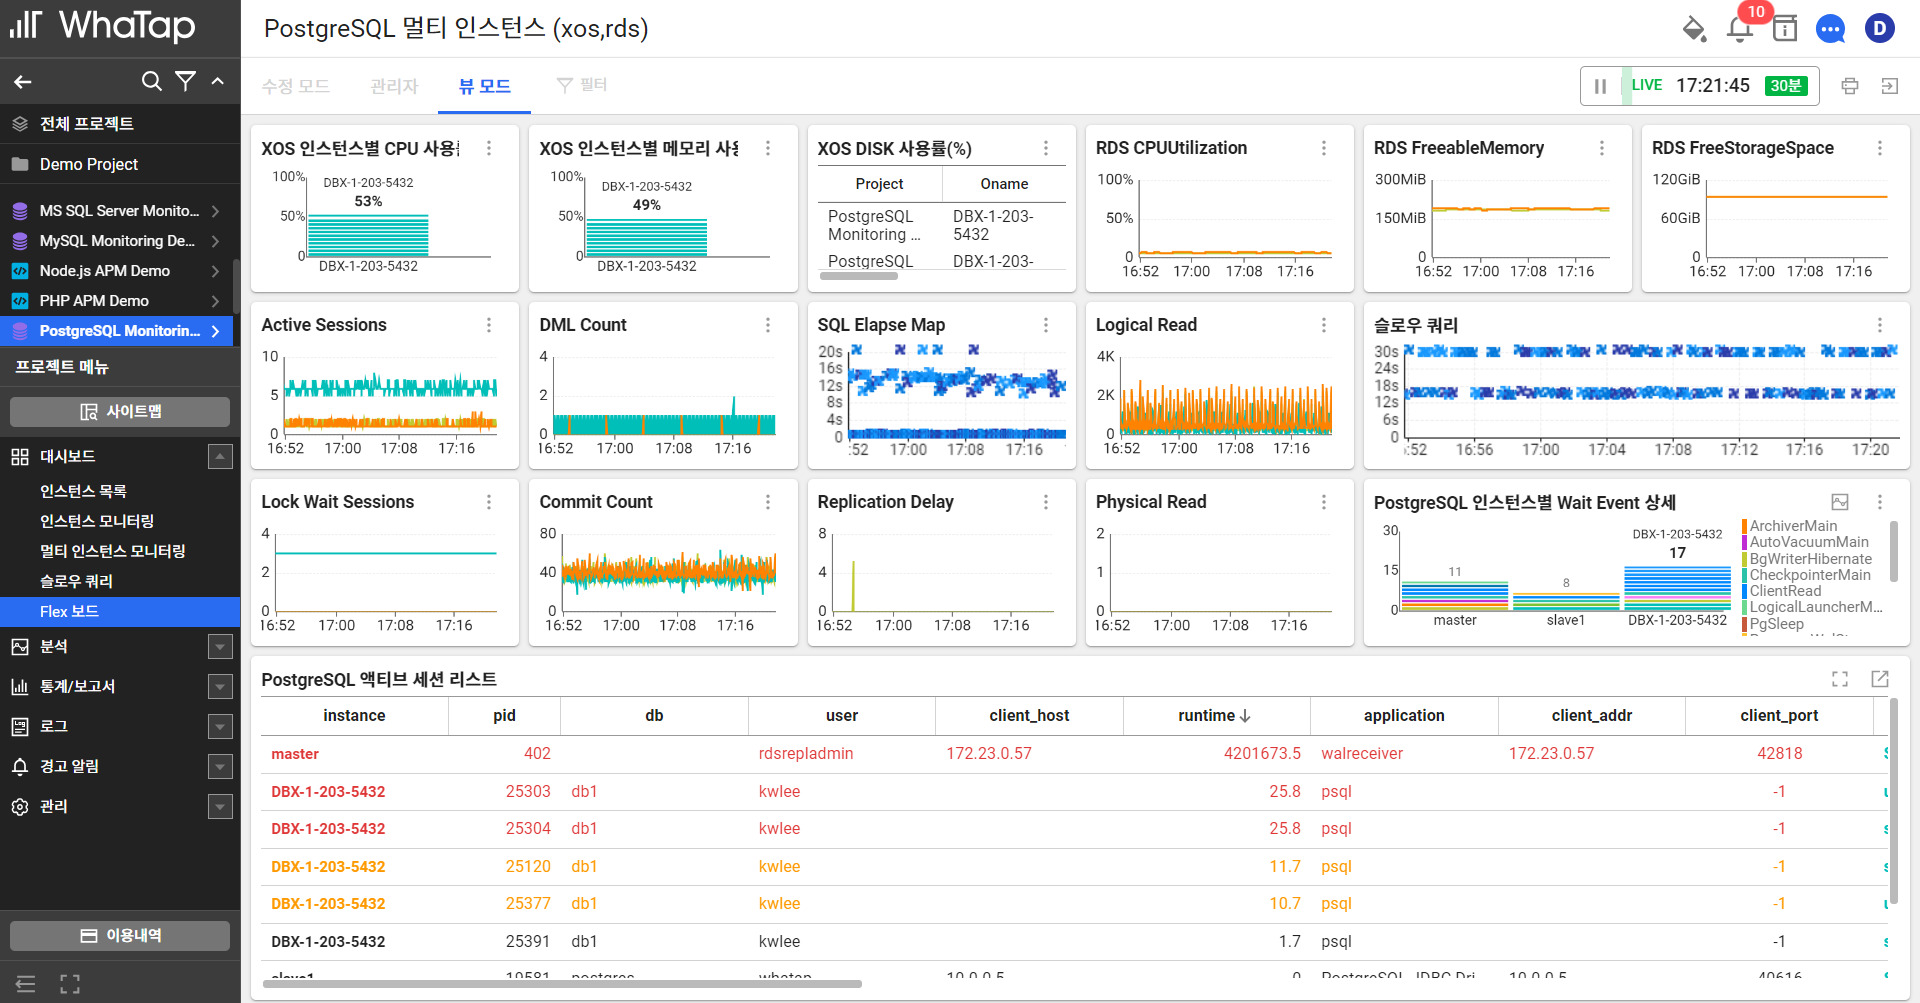
3. Throughput
Throughput is an essential performance measure of how much work the database you are using is doing. Different database platforms have different metrics for throughput, but you will typically want to look for things like the following.
- Database connection latency
- Number of active database connections
- Number of lookup queries in progress
- Number of Insert, Update, and Delete queries in progress
- Average time to complete a lookup query
- Average time to complete Insert, Update, and Delete queries
- Data replication latency between Master and Slave
- Number of completed transactions
- Percentage increase in data and transaction log size
- Percentage of times the in-memory data cache was accessed
- Heap memory used
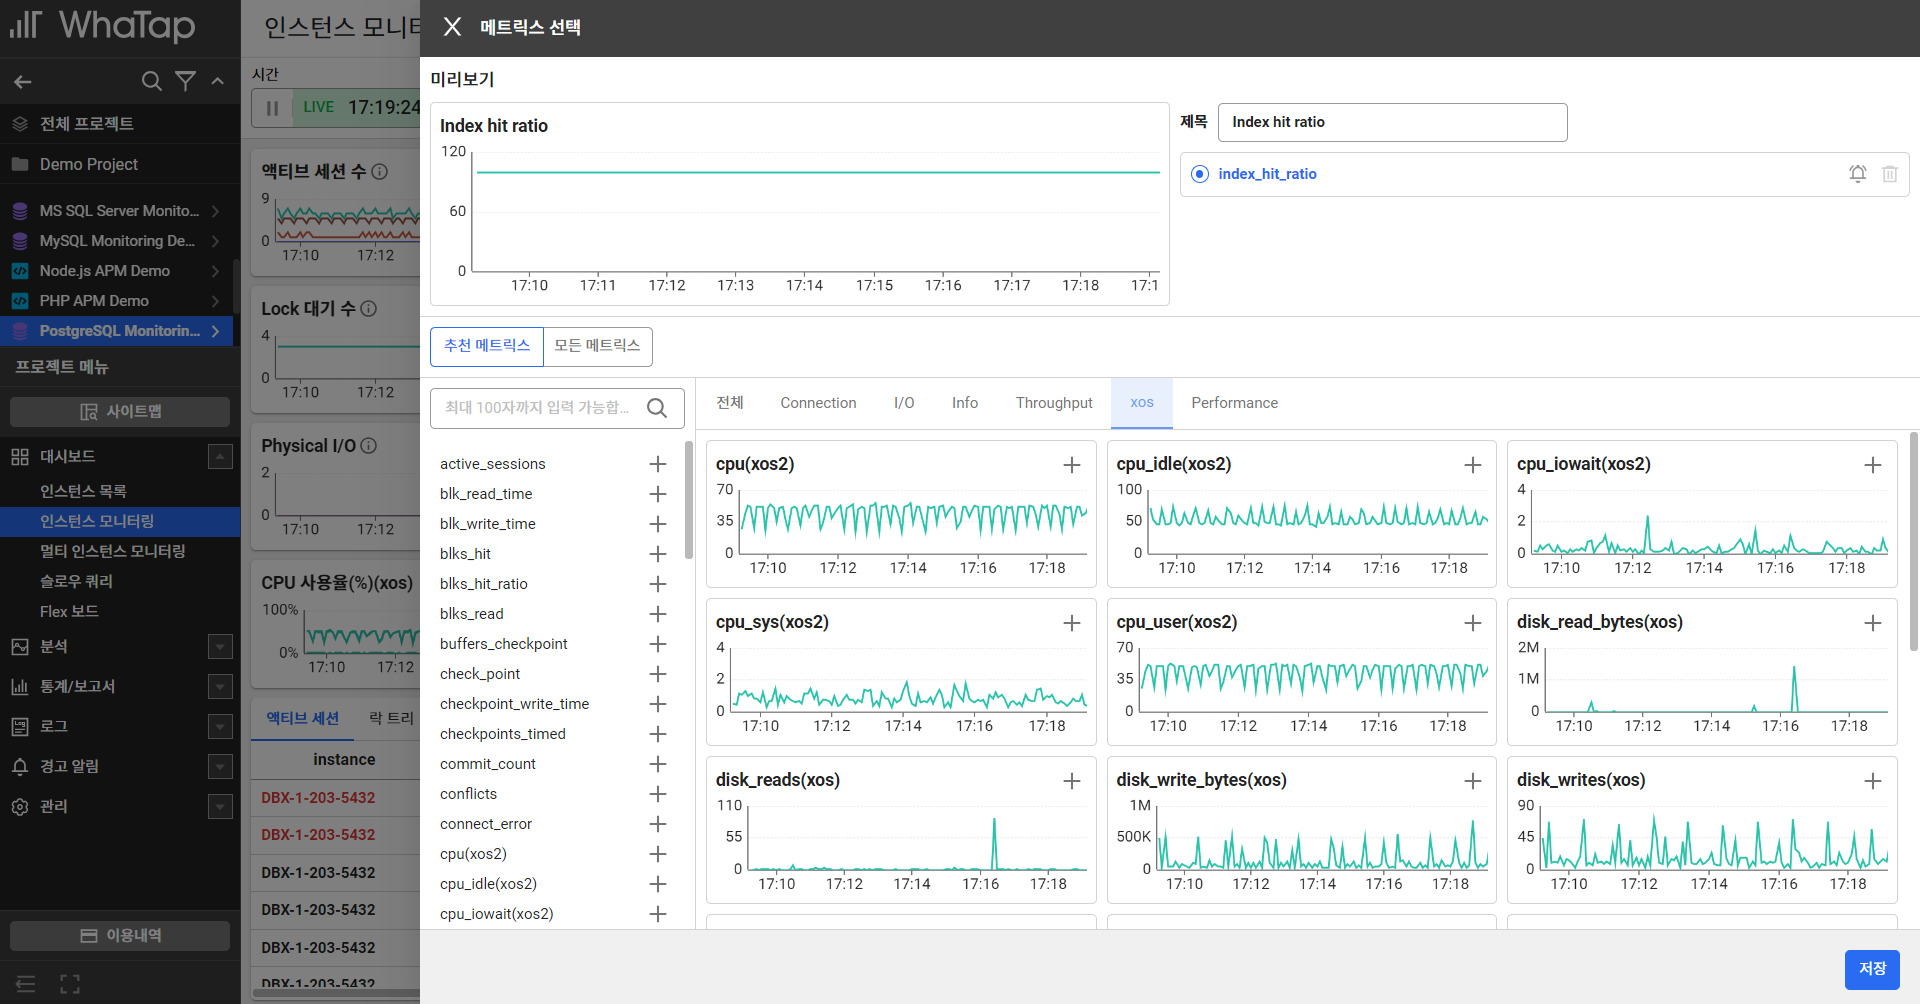
4. Performance
As with throughput, performance counters vary from database to database. Key performance metrics include the following.
- Number of read or write queries currently queued or blocked
- Percentage of times disk-based virtual memory was accessed
- Number of database lock timeouts
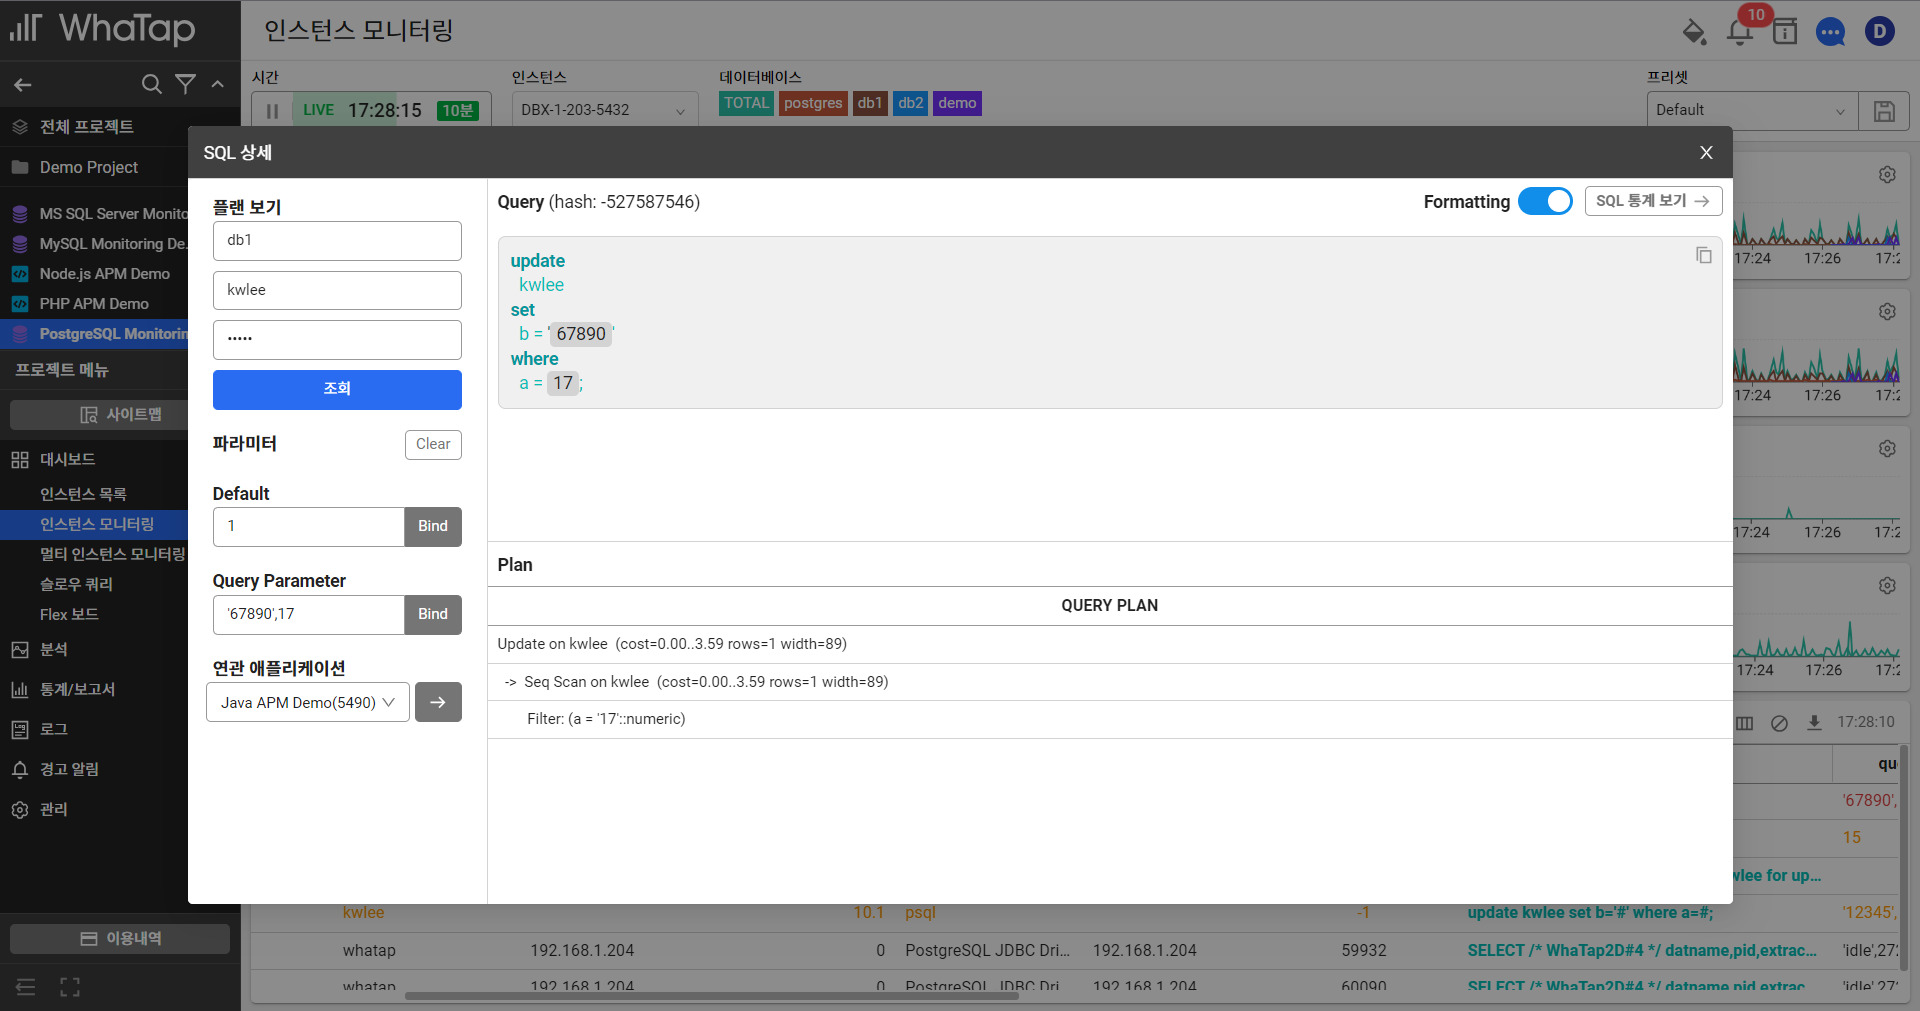
- Number of queries running slower than a set threshold
- Number of warnings raised for outdated statistics or unavailable indexes
- Application tracking
5. Batch Work (Schedule Tasks)
Databases often run repetitive tasks as scheduled "work". Some systems, such as Microsoft SQL Server or Oracle, have built-in task scheduling capabilities, while others use cron or third-party schedulers. Some examples of scheduled work include the following.
- Database backups
- Database maintenance tasks such as database cleaning, reindexing, statistical analysis and updates, database integrity checks, log rotation, compression, etc.
- Application-specific tasks, such as nightly data loads and exports, archiving, etc.
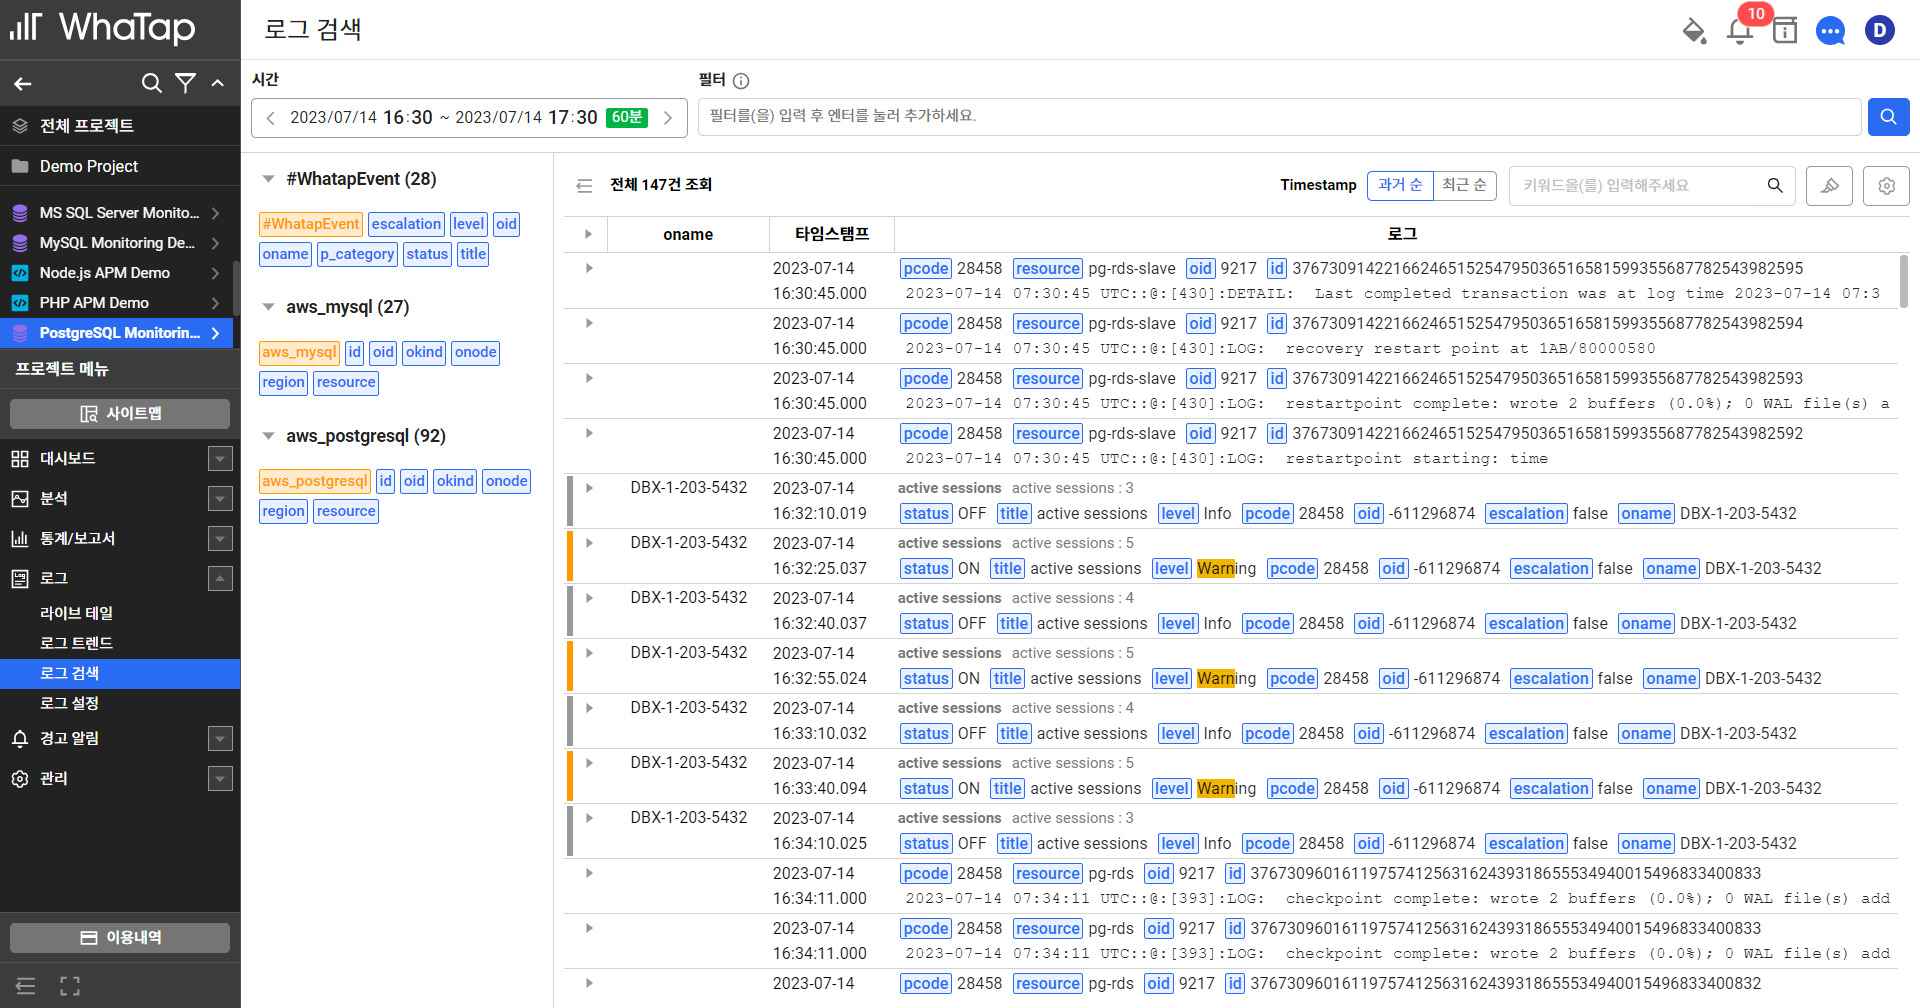
6. Log
The database writes its own logs. These logs can consist of one or more physical files. A monitoring tool must be able to collect, parse, and store these logs and generate metrics and dashboards from the events exposed by the logs. Because logs can contain database system health information, log management is one of the core requirements of database monitoring.
- Database system events (start, shutdown, errors, etc.)
- All user and system queries
- Output from scheduled tasks
Some databases come with their own monitoring tools by default, while others are monitored by DBAs that collect performance metrics with homegrown scripts and configure their own dashboards.
Application performance monitoring (APM) also aggregates database metrics.
While individual solutions can be used to monitor logs, applications, databases, and more, choosing one tool makes monitoring much easier.
- Collecting and storing the core database metrics and logs described above
- A lot of maintenance on the client side (e.g., infrastructure management, such as disk management on the monitoring server itself)
- Using lightweight agents to collect data
- Having a variety of actively maintained plugins and hooks
- Correlating log events with performance metrics from databases, OS, etc.
- Drill down into events or queries
- Creating dashboards with metrics and logs
- Raising alerts when performance thresholds are exceeded
- Sending automated alerts via messenger channels like Telegram and Slack
Closing Thoughts
These are the must-see metrics for database performance management. We recommend using an integrated monitoring platform to manage not only database performance, but also the logs it generates and the applications it supports.


