.svg)
.svg)


Introduction
WhaTap provides integrated monitoring across services and systems, including applications, servers, databases, Kubernetes, and web browsers. When it comes to monitoring, being alerted before something dangerous happens is just as important as seeing it.
So, who are some of the people who use WhaTap's alerts to help?
1. Application developers
WhaTap can monitor the processing status of errors and contextual transactions in your application in real time, and send notifications to developers to help them quickly identify issues.
For example, if an application's response time increases or an error occurs, developers are notified so they can quickly find out what part of the application logic is causing the problem and take better action to improve the application's performance.
2. Infrastructure Operator
Infrastructure Operator helps you quickly detect and act on system resources that need to be maintained and scaled up in real time with WhaTap. This helps improve system availability and minimize service downtime.
For example, in addition to integrated monitoring of your infrastructure's performance metrics, you can set thresholds on metrics such as CPU utilization, memory usage, and disk I/O, and be notified when certain resources are reaching their limits so you can take action to scale to maintain system performance.
3. Predictor of the future
With WhaTap monitoring notification settings, you can not only monitor the current situation, but also predict and prepare for future risks based on it.
For example, by looking at trends in system resource usage and past notification histories, infrastructure operators can plan for additional scaling efforts and prevent infrastructure failures in advance.
Application developers can also use this information to focus on performance tuning to handle problematic transactions in a well-resourced environment.
At the end of the day, alerting with WhaTap can help both application developers and infrastructure operators detect and remediate failures, monitor performance, improve user experience, and future-proof their systems.
So how do you set up notifications in WhaTap for your service and business?
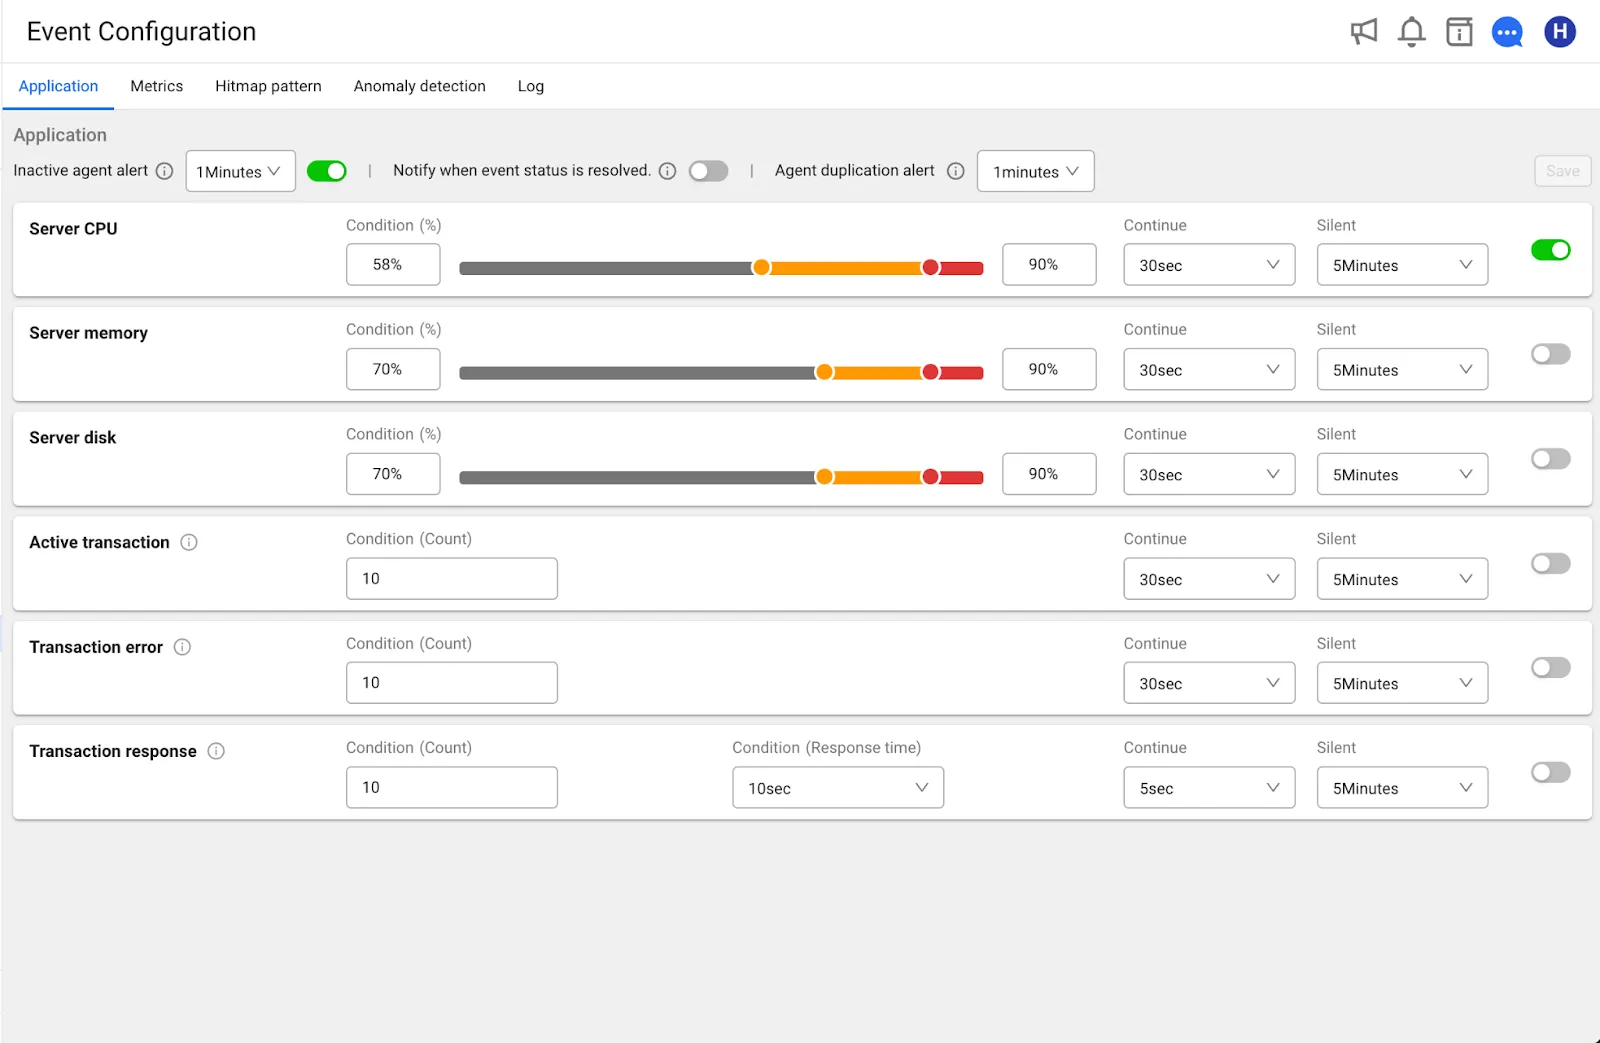
The first way is to use the default notification template.
We have prepared default templates for important metrics recommended by WhaTap. Just flip a switch and you are ready to go with instant alert settings.
Path: [Alert Notifications] → [Event Settings] → [Project Type]
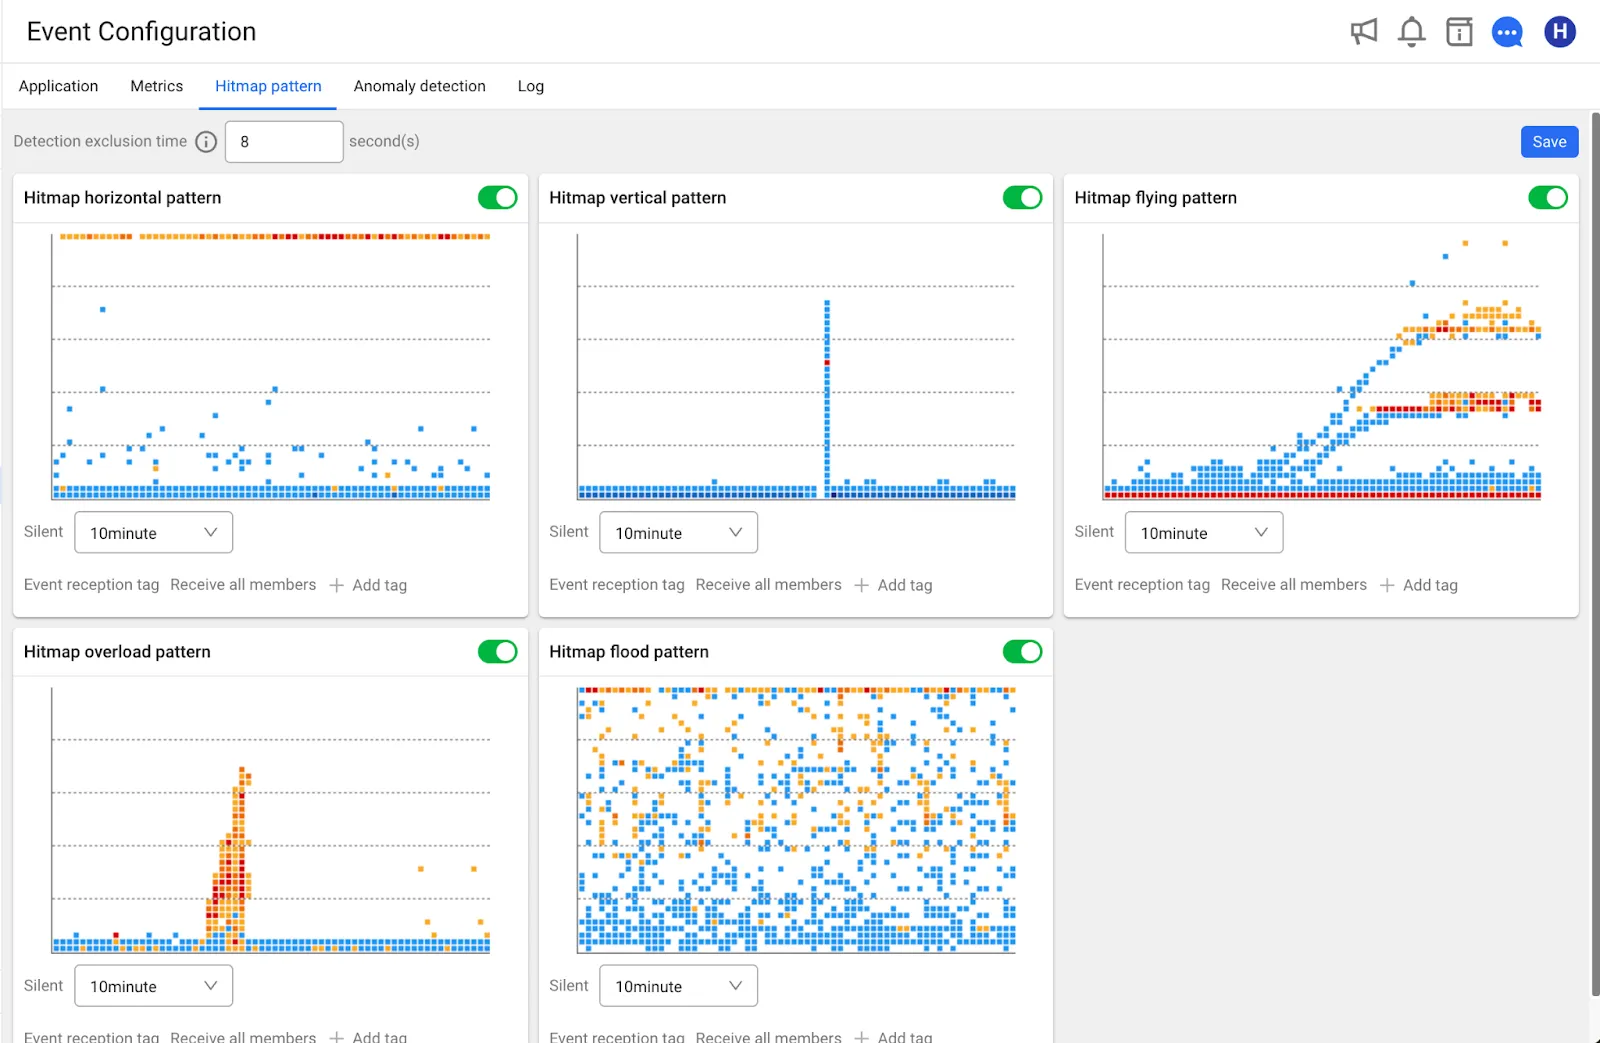
You can also receive alerts using the heatmap pattern .
Machine learning automatically recognizes response times and patterns in transactions and sends alert notifications. It is also available immediately with the flip of a switch, thanks to defined critical metrics recommended by WhaTap.
Path: [Alert notifications] → [Event settings] → [Heatmap patterns].
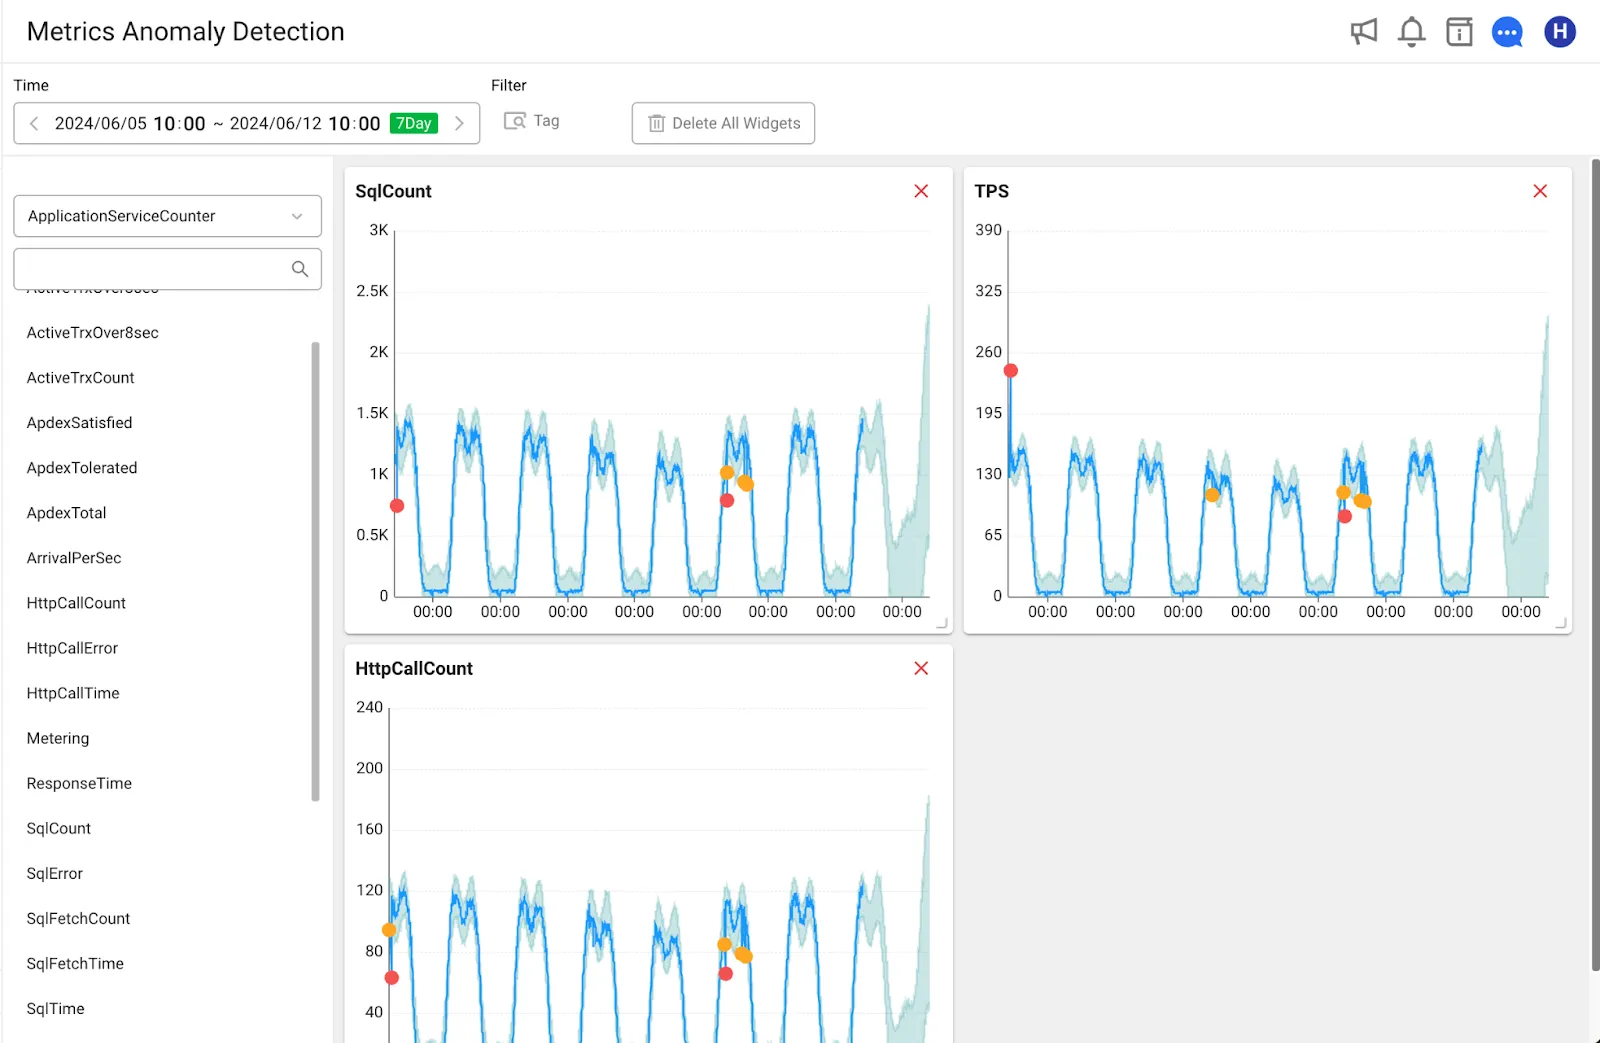
Detect metrics anomalies to see expected patterns.
AI trains on a variety of metrics to identify expected patterns. Of course, you can also identify areas that deviate from the predictions, which can help you define future alert thresholds.
Path: [Sitemap] → [Metrics Anomaly Detection]
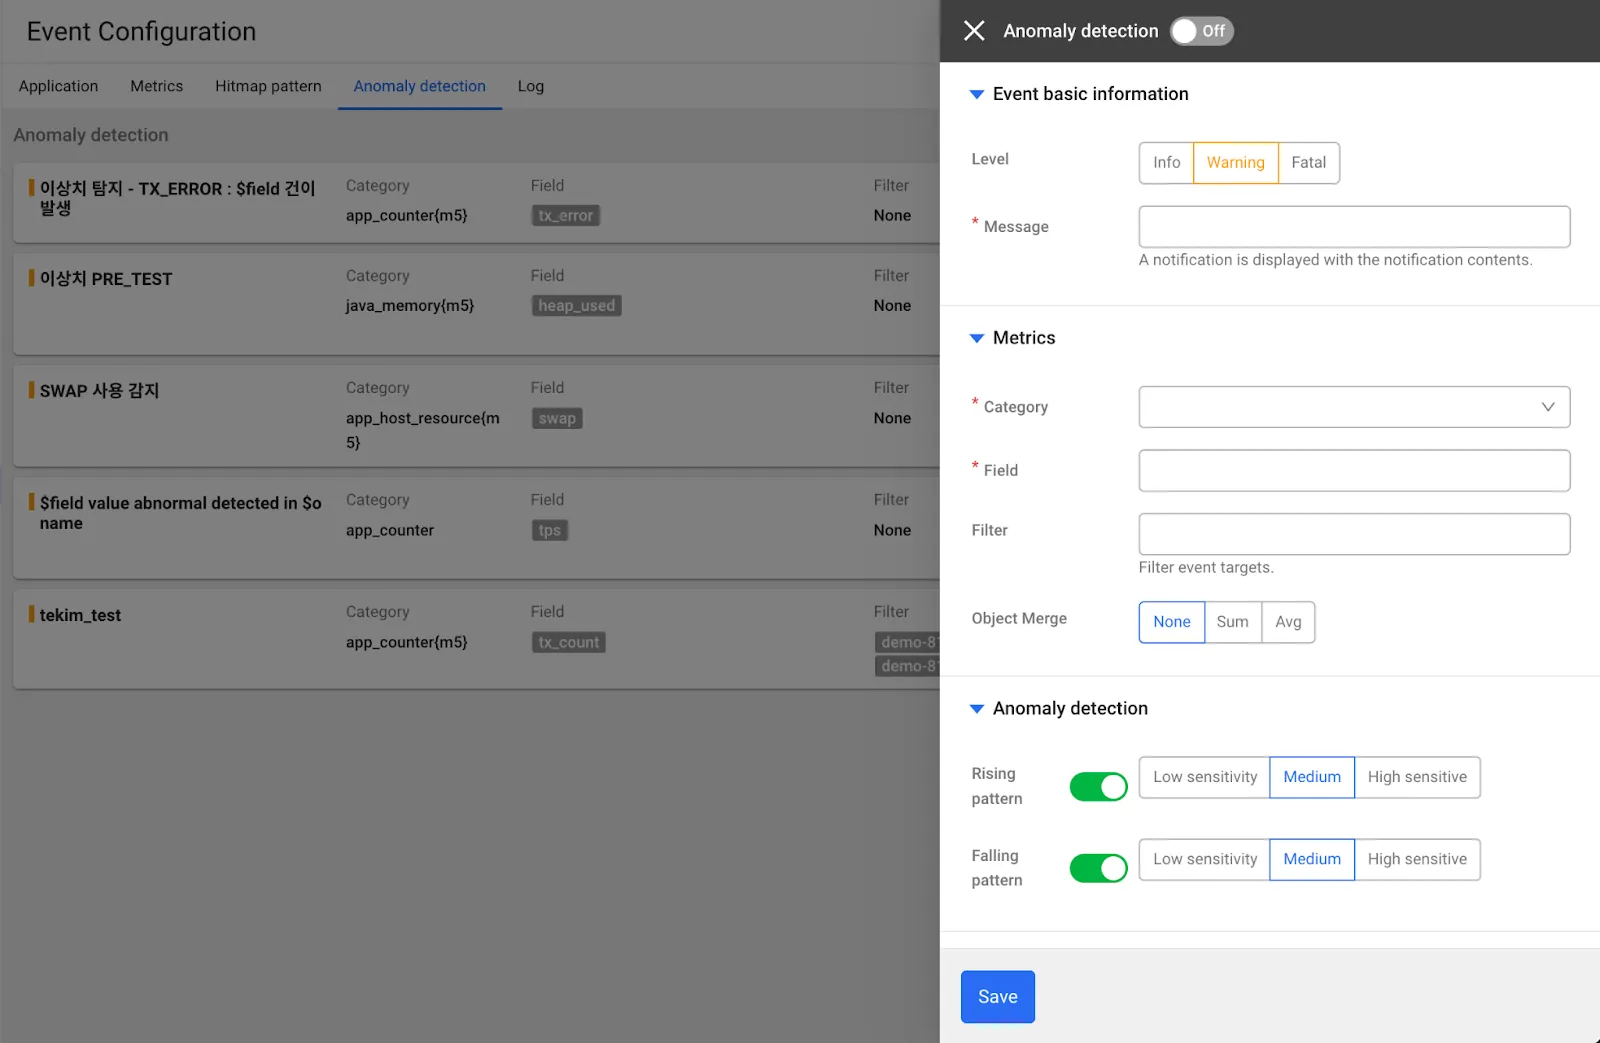
If you only want to look at the metrics you are interested in, consider setting up outlier detection alerts.
You can set up the metrics you are interested in in the "Metrics anomaly detection" section above, and have automatic alerts triggered based on your sensitivity to detect upward or downward movement in a predicted pattern.
Path: [Alert notifications] → [Event settings] → [Outlier detection]
Now that you are done setting up customized notifications in WhaTap Monitoring, let's take a look at a scenario to see how you can use notifications in a specific situation 😉
*Please note that the scenario is based on a fictitious company.
Case 1. The story of Exchange A
There was once a virtual currency exchange, Exchange A, that dominated the market. It was popular around the world and was used by many investors.
One day, WhaTap's monitoring solution, which utilizes AI/ML technology, detected a sudden increase in trading volume. Based on the volume trends that Company A had learned, this was an unexpected spike in volume.
WhaTap recognized this as an anomaly and raised an alert to notify Company A's IT team. From an infrastructure perspective, the IT team noticed abnormally high CPU usage and spikes in memory usage.
Based on transaction traces from application monitoring, they also realized that a large-scale hacking attack was underway in the financial markets. The hackers were maliciously increasing transaction volumes and overloading system resources.
The IT team quickly paused A's trading service and began an emergency inspection. At the same time, the security team implemented enhanced security measures to prevent the hacking attack. In the end, the hackers were unable to take over A's trading system. This day reminded the IT team of the monitoring solution's alert notification capabilities.
They were able to detect spikes in trading volume and unusual behavior based on the trained data from WhaTap monitoring, and were able to proactively prepare for risks in the financial markets.
Case 2. The story of food delivery service B
Company B, a food delivery service, delivers delicious dinners to customers through its mobile application and website.
On the day South Korea advanced to the quarterfinals of the World Cup, B noticed a sharp increase in order fulfillment times through WhaTap monitoring, causing customers to take longer than expected to receive their orders.
Application monitoring identified a bottleneck in the fulfillment system as the cause of the performance degradation, and Service B reacted quickly on the infrastructure side by scaling up additional servers. This allowed them to minimize customer frustration and maintain the quality and reliability of their service within a short period of time.
Closing thoughts
In this article, we have covered how to set up alerts in WhaTap Monitoring and the importance of alerts in monitoring. Finally, you can also check out our guide on how to set up notifications, so we recommend checking out the link below and utilizing it according to your monitoring service!


