.svg)
.svg)


The metrics to watch in Java monitoring are Heap memory metrics and GC metrics. Heap memory is very important for tuning and performance management, and is great for tuning and setting policies.
When the Heap runs out of memory, it can cause performance issues. In fact, a long delay in running a full GC can cause timeouts in the chained part.
In this WhaTip, we will introduce you to the JVM Heap memory area. 😊
JVM Heap Memory Area
There are three main areas that the JVM manages: the Stack, the Heap, and the Static Area.
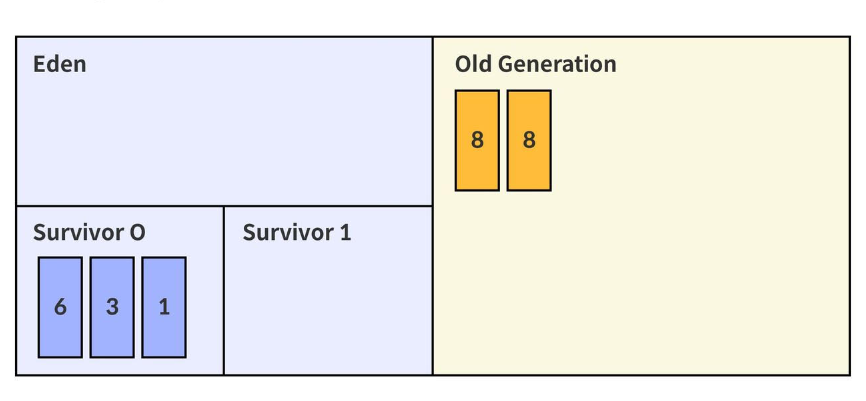
I would like to introduce the Heap area. Heap is divided into two major categories, Young Generation and Old Generation, as shown below.
1. Young Generation
In the Young region, new objects are allocated to the Eden region. When the Eden region becomes full, a Minor GC occurs and the Mark & Sweep algorithm is performed. When a new object is assigned to the Eden region, it explores the Reachable and Unreachable objects, and the surviving objects are moved to one of the Survivor regions.
(One of the Survivor zones must be left empty. If you are assigned to Survivor 0, then the other side, Survivor 1, must be empty.)
The Sweep process will delete Unreachable objects and increment the age values of the survivors.
2. Old Generation
When an object's age value reaches a certain threshold, it is moved to the Old Generation.
When the Old Generation region becomes full of objects with high age values, a Major GC occurs. The Young region has fewer and shorter-lived objects, while the Old region has many objects. In fact, the percentage of Young Generation is much smaller than the percentage of Old Generation.
When a Minor GC occurs, quite a few objects are collected, which can prevent frequent memory waste. On the other hand, when a major GC occurs, the application does nothing, so you want to minimize the number of times it happens.
3. Garbage Collection (GC)
GC refers to the ability of a Java application to delete unused objects from memory.
It distinguishes between referenced and unreferenced objects in memory, and then removes all unreferenced objects to prevent memory leaks.
4. Full GC
Heap is very good at tuning and setting policies, but when it comes to performance, it is running out of memory that causes problems. The direct impact is when a Full GC occurs.
When a Full GC (or Major GC) occurs, your Java application will crash. Depending on the severity and duration of a Full GC, it can have a significant impact on the performance and stability of your application, so you should work to reduce its duration and frequency.
You can count them and use tools to see what's going on, but if you want to log full GCs separately, you can use additional frameworks to notify you when a full GC has occurred.
Closing thoughts
In this content, we introduced the concept of Garbage Collection and how it works. In the next content, we will practice monitoring GC with example code.


