
Discover the insights you need to solve problems
LLM Observability: Metrics & Strategy for Production LLM Apps
Learn the core LLM observability metrics and build strategy for controlling hallucination, runaway costs, and performance degradation in production LLM apps.
The Agentic AI Era: Observability and Harness Engineering
Exploring how the cumulative evolution of prompt, context, and harness engineering positions WhaTap to become a dedicated observability agent in the age of Agentic AI.

What an Average of 136 Doesn't Tell You: Monitoring's Blind Spots Through CGM Data
This article uses CGM glucose data to reveal the hidden dangers of variability that averages obscure, drawing a parallel to system monitoring to highlight the importance of pattern-based monitoring.
What Is Kubernetes (K8s)? Concepts, Benefits, and How It Differs from Docker
This article breaks down everything from Kubernetes fundamentals to how it differs from Docker and how it's used in practice — all in a way that's easy for beginners to follow.
Comparing AI Inference Optimization Tools: TensorRT vs ONNX Runtime vs Triton
A comparison of AI inference optimization tools — TensorRT, ONNX Runtime, and Triton — along with strategies for more efficient GPU utilization and monitoring.

Networking Fundamentals: From LAN and WAN to Routers and Protocols
What exactly is a network? This guide breaks down the basics in plain language — the difference between LAN and WAN, essential devices like routers and switches, and protocols, the rules that make communication possible. Written for developers and non-technical readers alike.
AI-Native Observability: What It Means and How WhaTap Is Building It
WhaTap Labs' AI-Native Observability platform combines a dedicated data lake, autonomous root cause analysis, and natural language interface to streamline IT operations through AI-human collaboration.
WhaTap x ilert: From AI-Native Observability to AI-First Incident Response
WhaTap’s native integration with ilert connects AI-driven observability and AI-first incident response, enabling DevOps and IT teams to move seamlessly from real-time detection to automated resolution within a unified workflow.
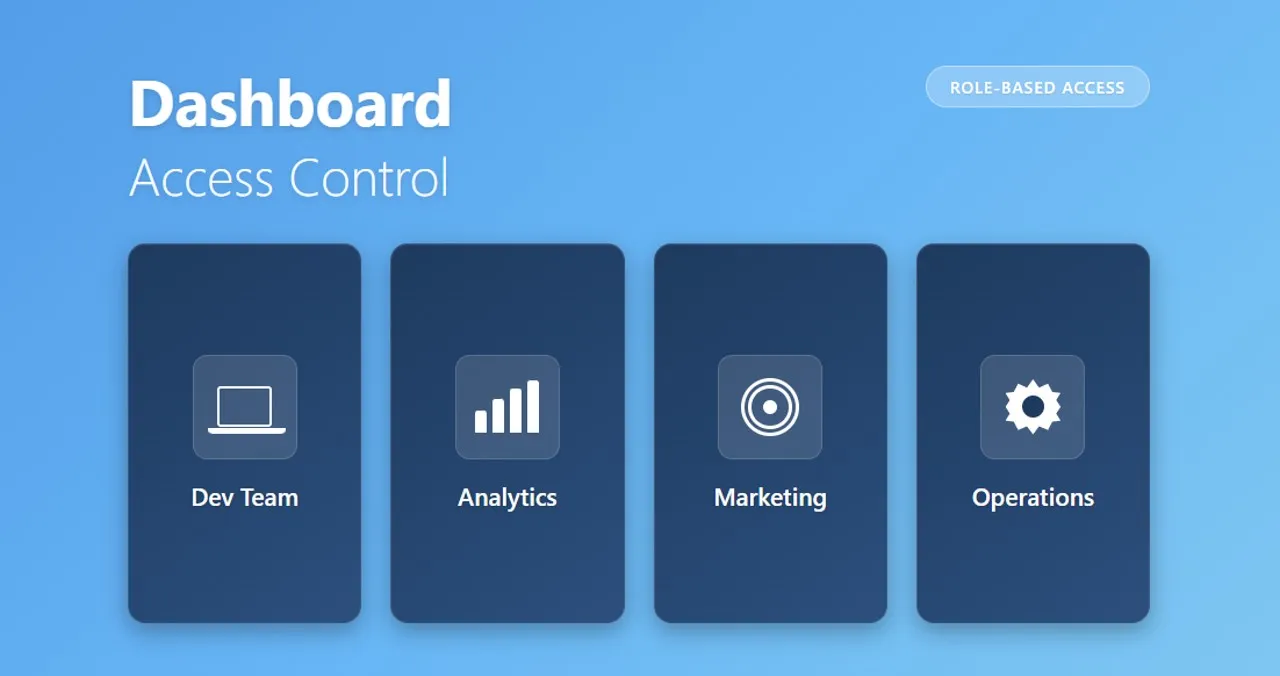
[How To WhaTap] Building User-Specific Monitoring Dashboards
User-specific monitoring dashboards ensure that each team sees only the data and functions relevant to their role, improving efficiency, reducing confusion, and strengthening access control as systems scale.
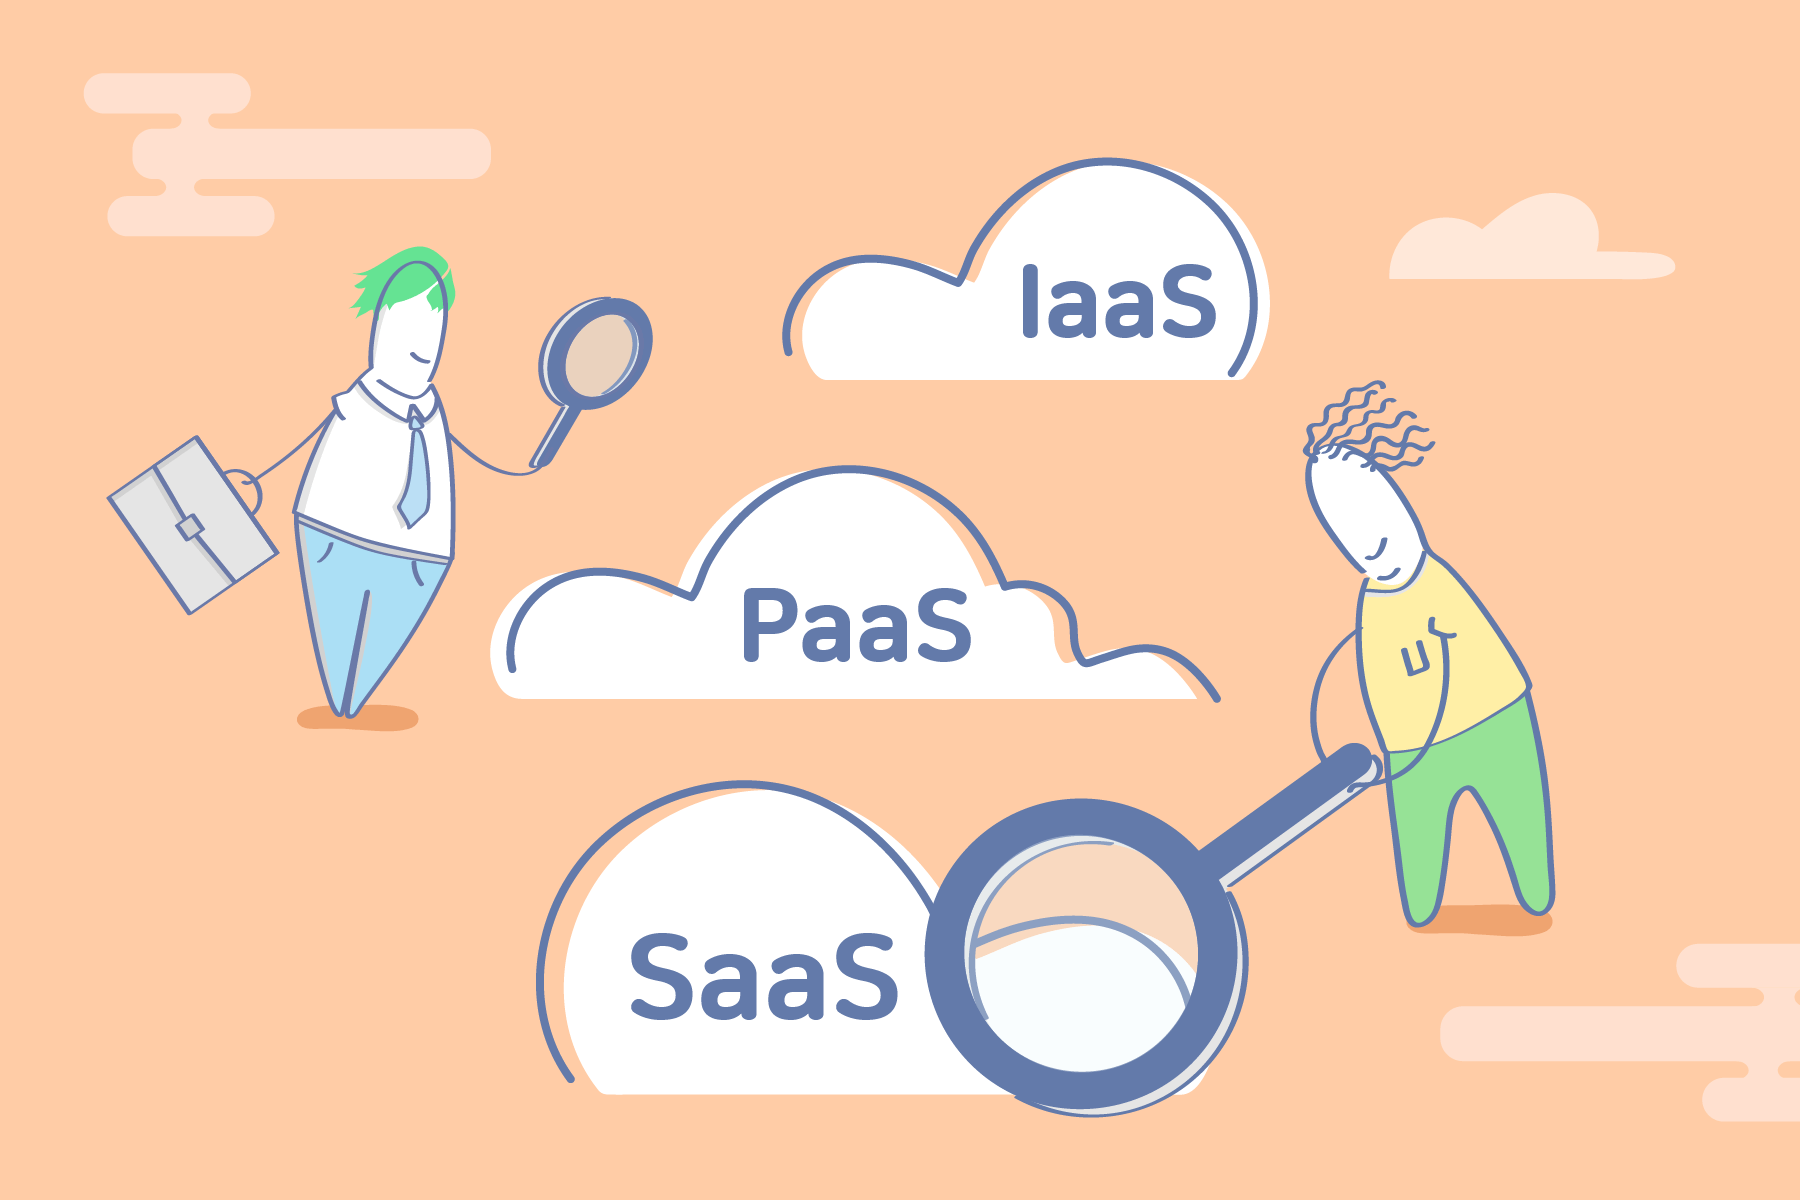
Cloud Basics: IaaS, PaaS, & SaaS Explained
Depending on the level of service, cloud computing is divided into IaaS, PaaS, and SaaS. Understanding the distinct characteristics and trade-offs of each model is key to choosing the right cloud strategy for your business.
Claude Code Monitoring: A Guide to Tracking AI Developer Tool Usage
AI development tools such as Claude Code can maximize the effectiveness and competitiveness of AI utilization from individuals to enterprises through systematic monitoring covering cost management, productivity, security, and collaboration.
Retrofit 3.0 update: major changes and what the Kotlin transition means
This article summarizes the basic features and benefits of Retrofit 3.0, which was released as a major update on May 15, 2025, and major changes and their implications, such as Kotlin-centered design.
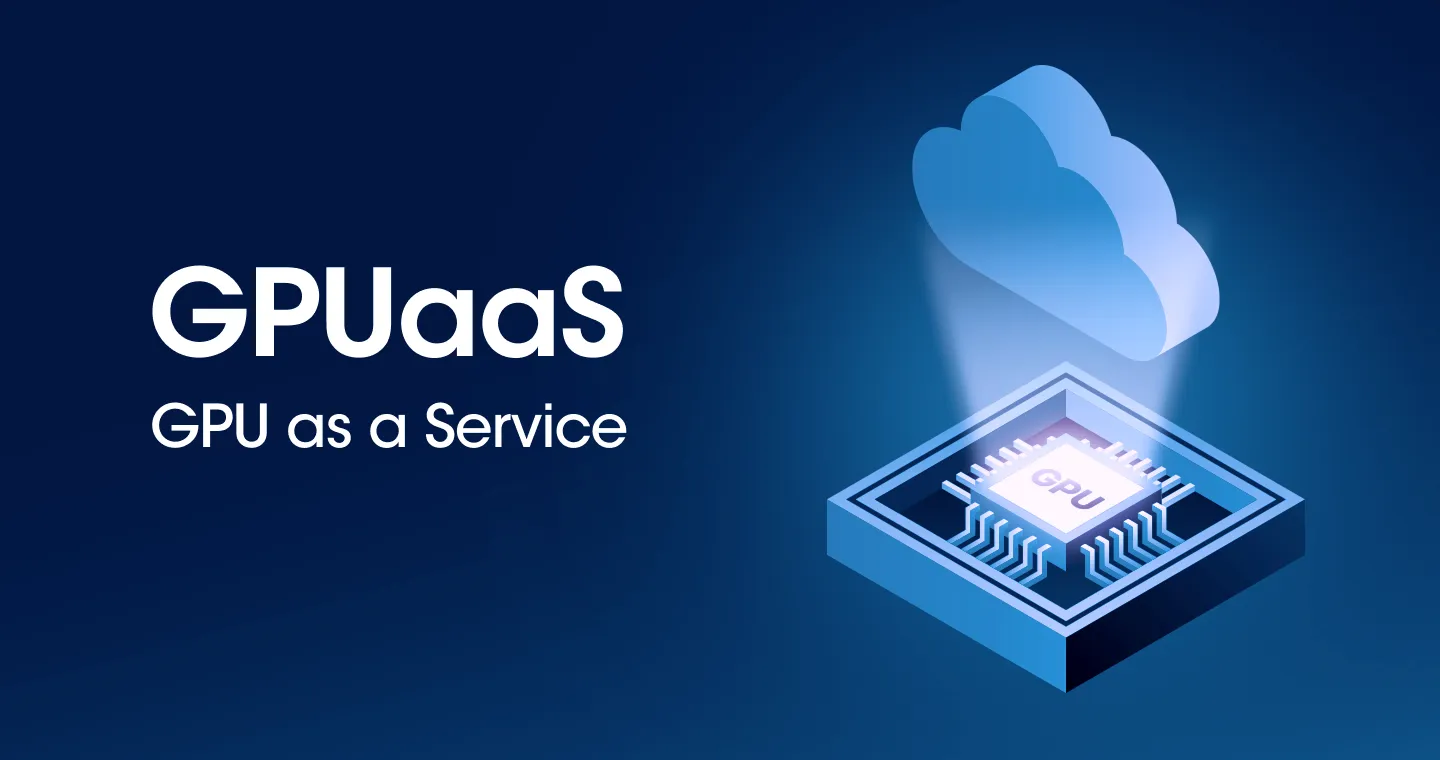
GPU on subscription? Here’s what GPUaaS (GPU as a Service) means
GPUaaS is a service that allows you to rent high-performance GPUs as needed from the cloud, making it possible to perform computationally intensive tasks such as AI development and image rendering at a lower cost and flexibility.
Monitoring NVIDIA GPUs in Kubernetes - (1) Collecting DCGM-Exporter Metrics
The process of activating an NVIDIA GPU in a Kubernetes environment and collecting performance metrics with DCGM-Exporter is introduced as a minikube-based test.
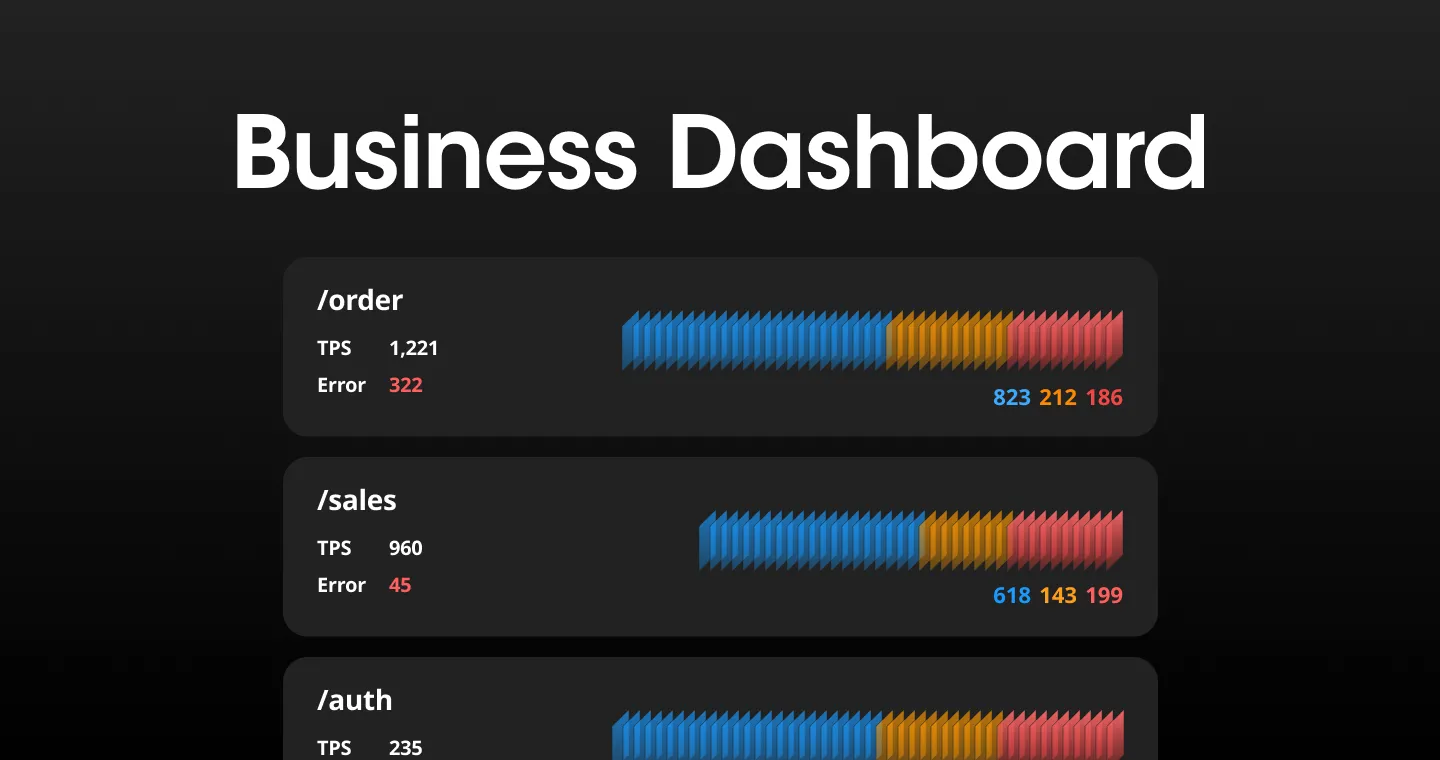
How should I monitor my business?
In an increasingly complex system environment, WhaTap provides a 'business dashboard' that can easily identify transactions and failures using only domain knowledge, and also supports automatic classification based on RESTful APIs.